20 Years
The Foundational Discovery
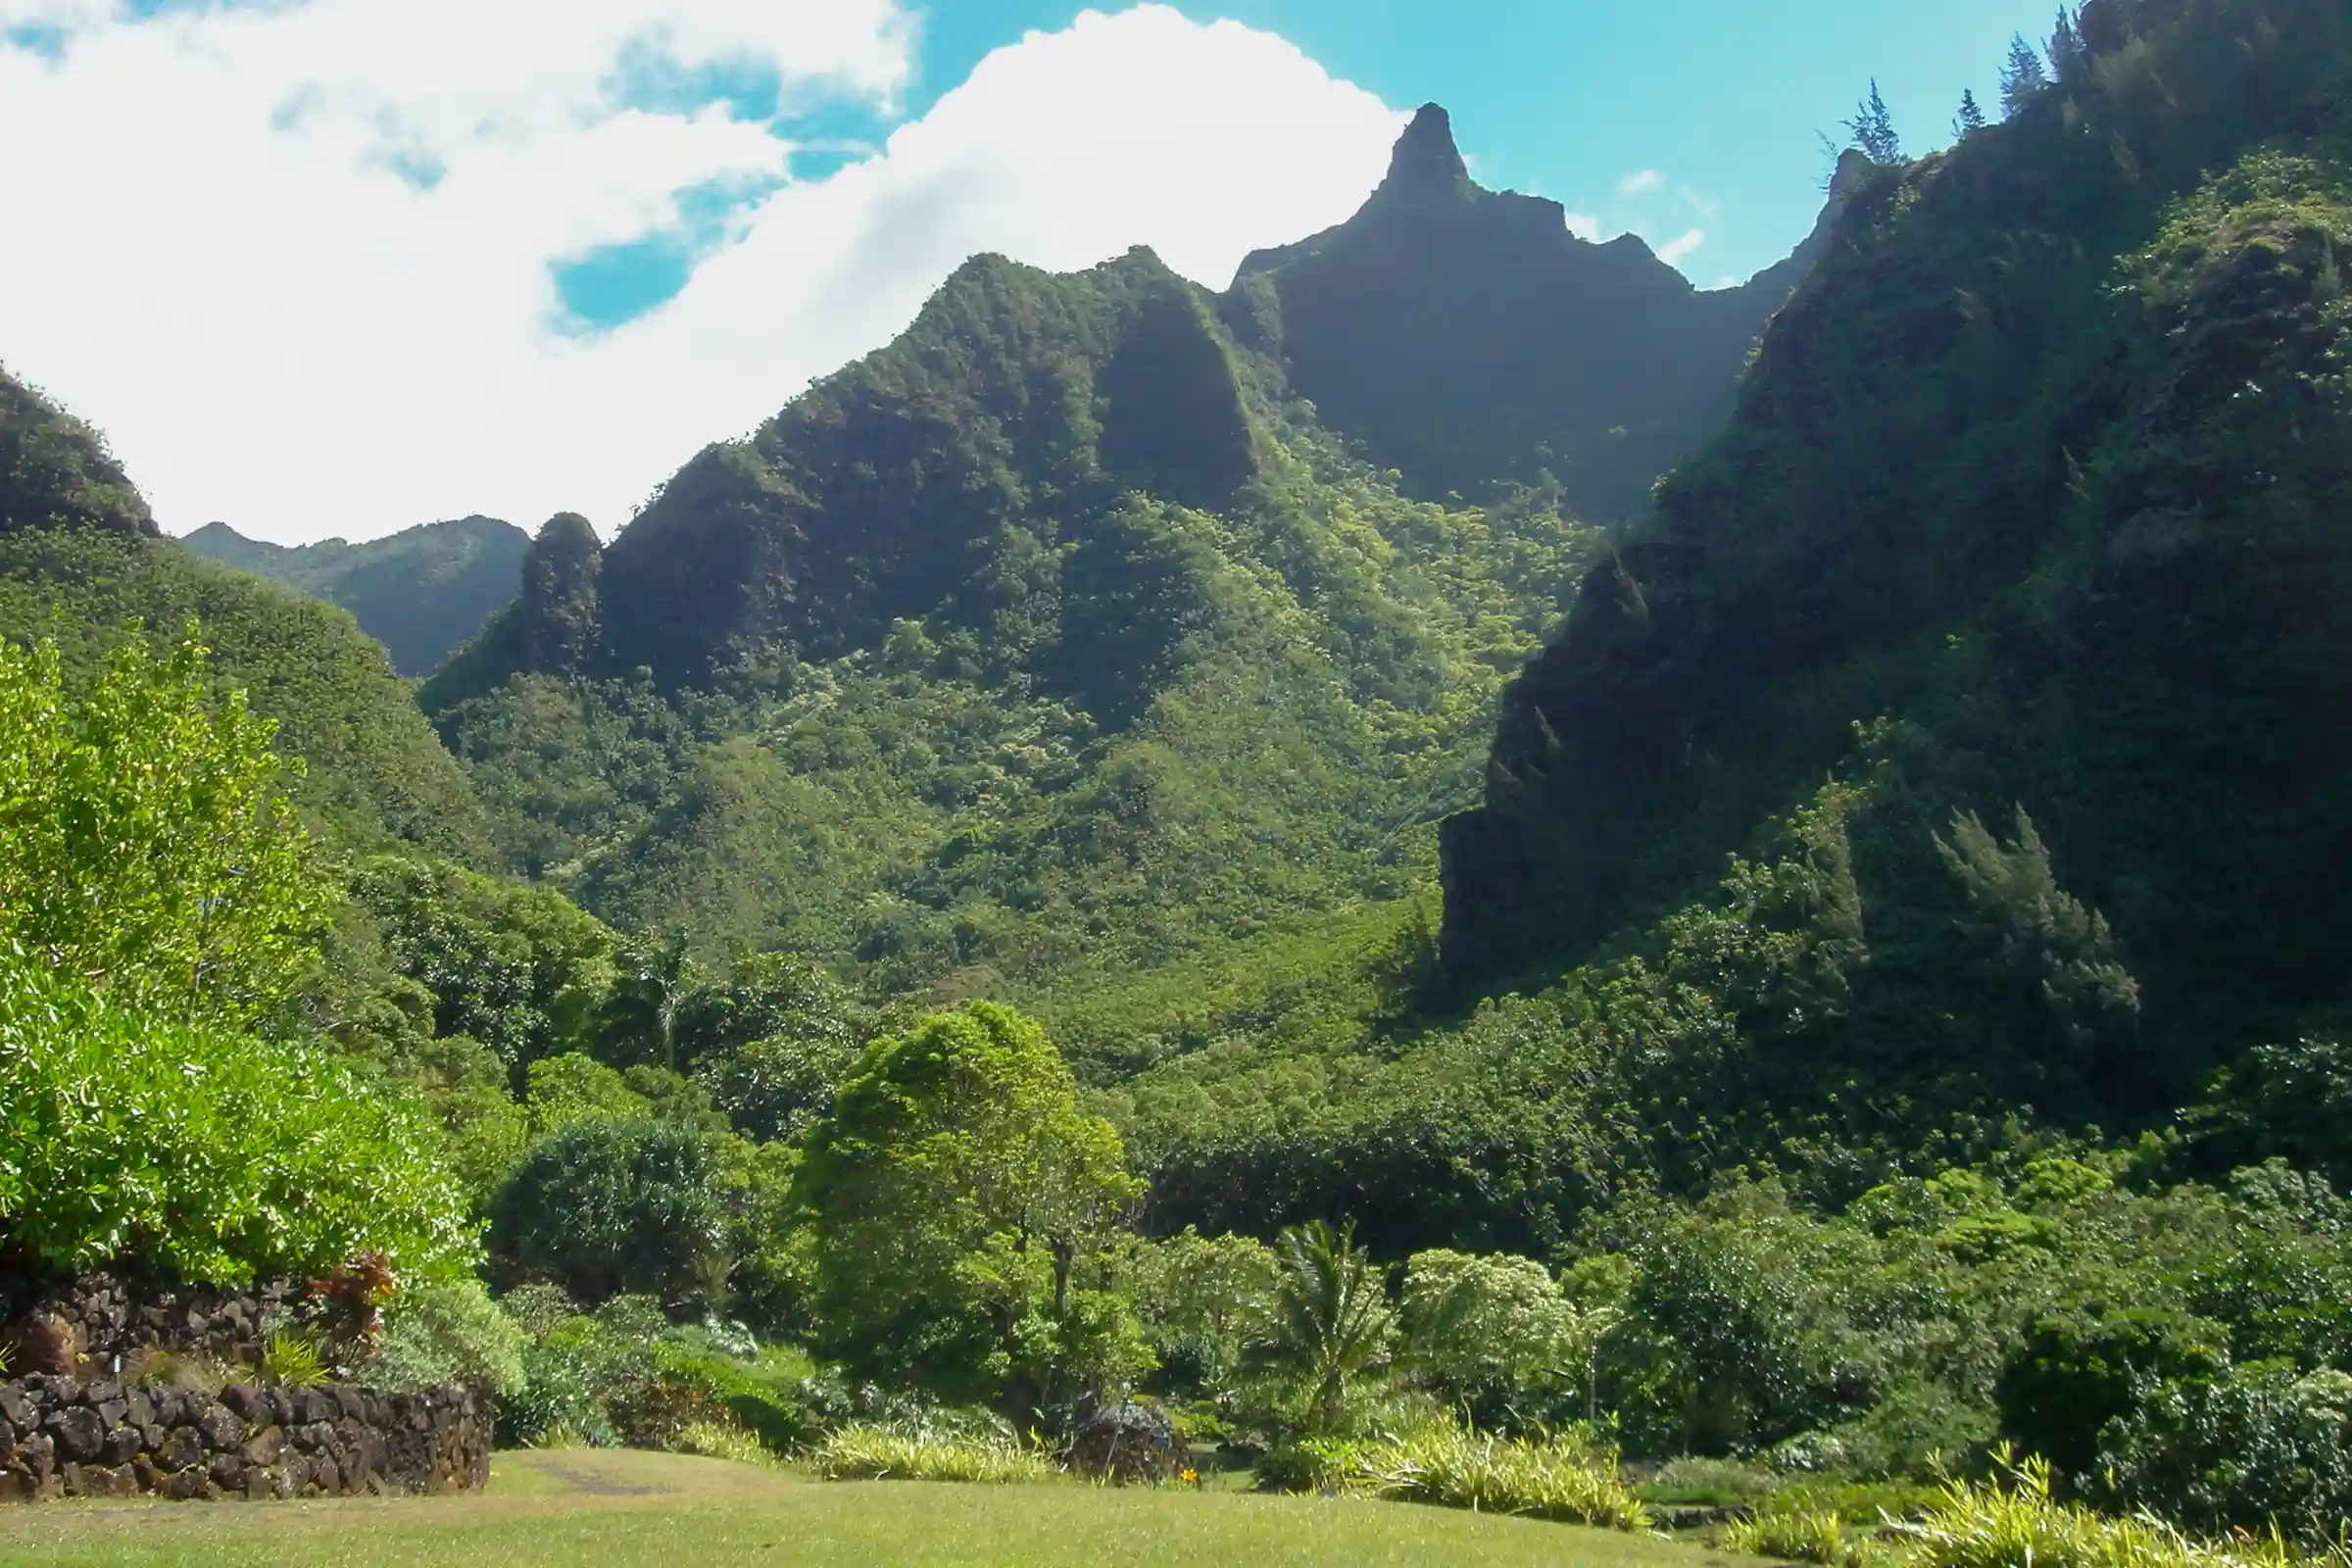
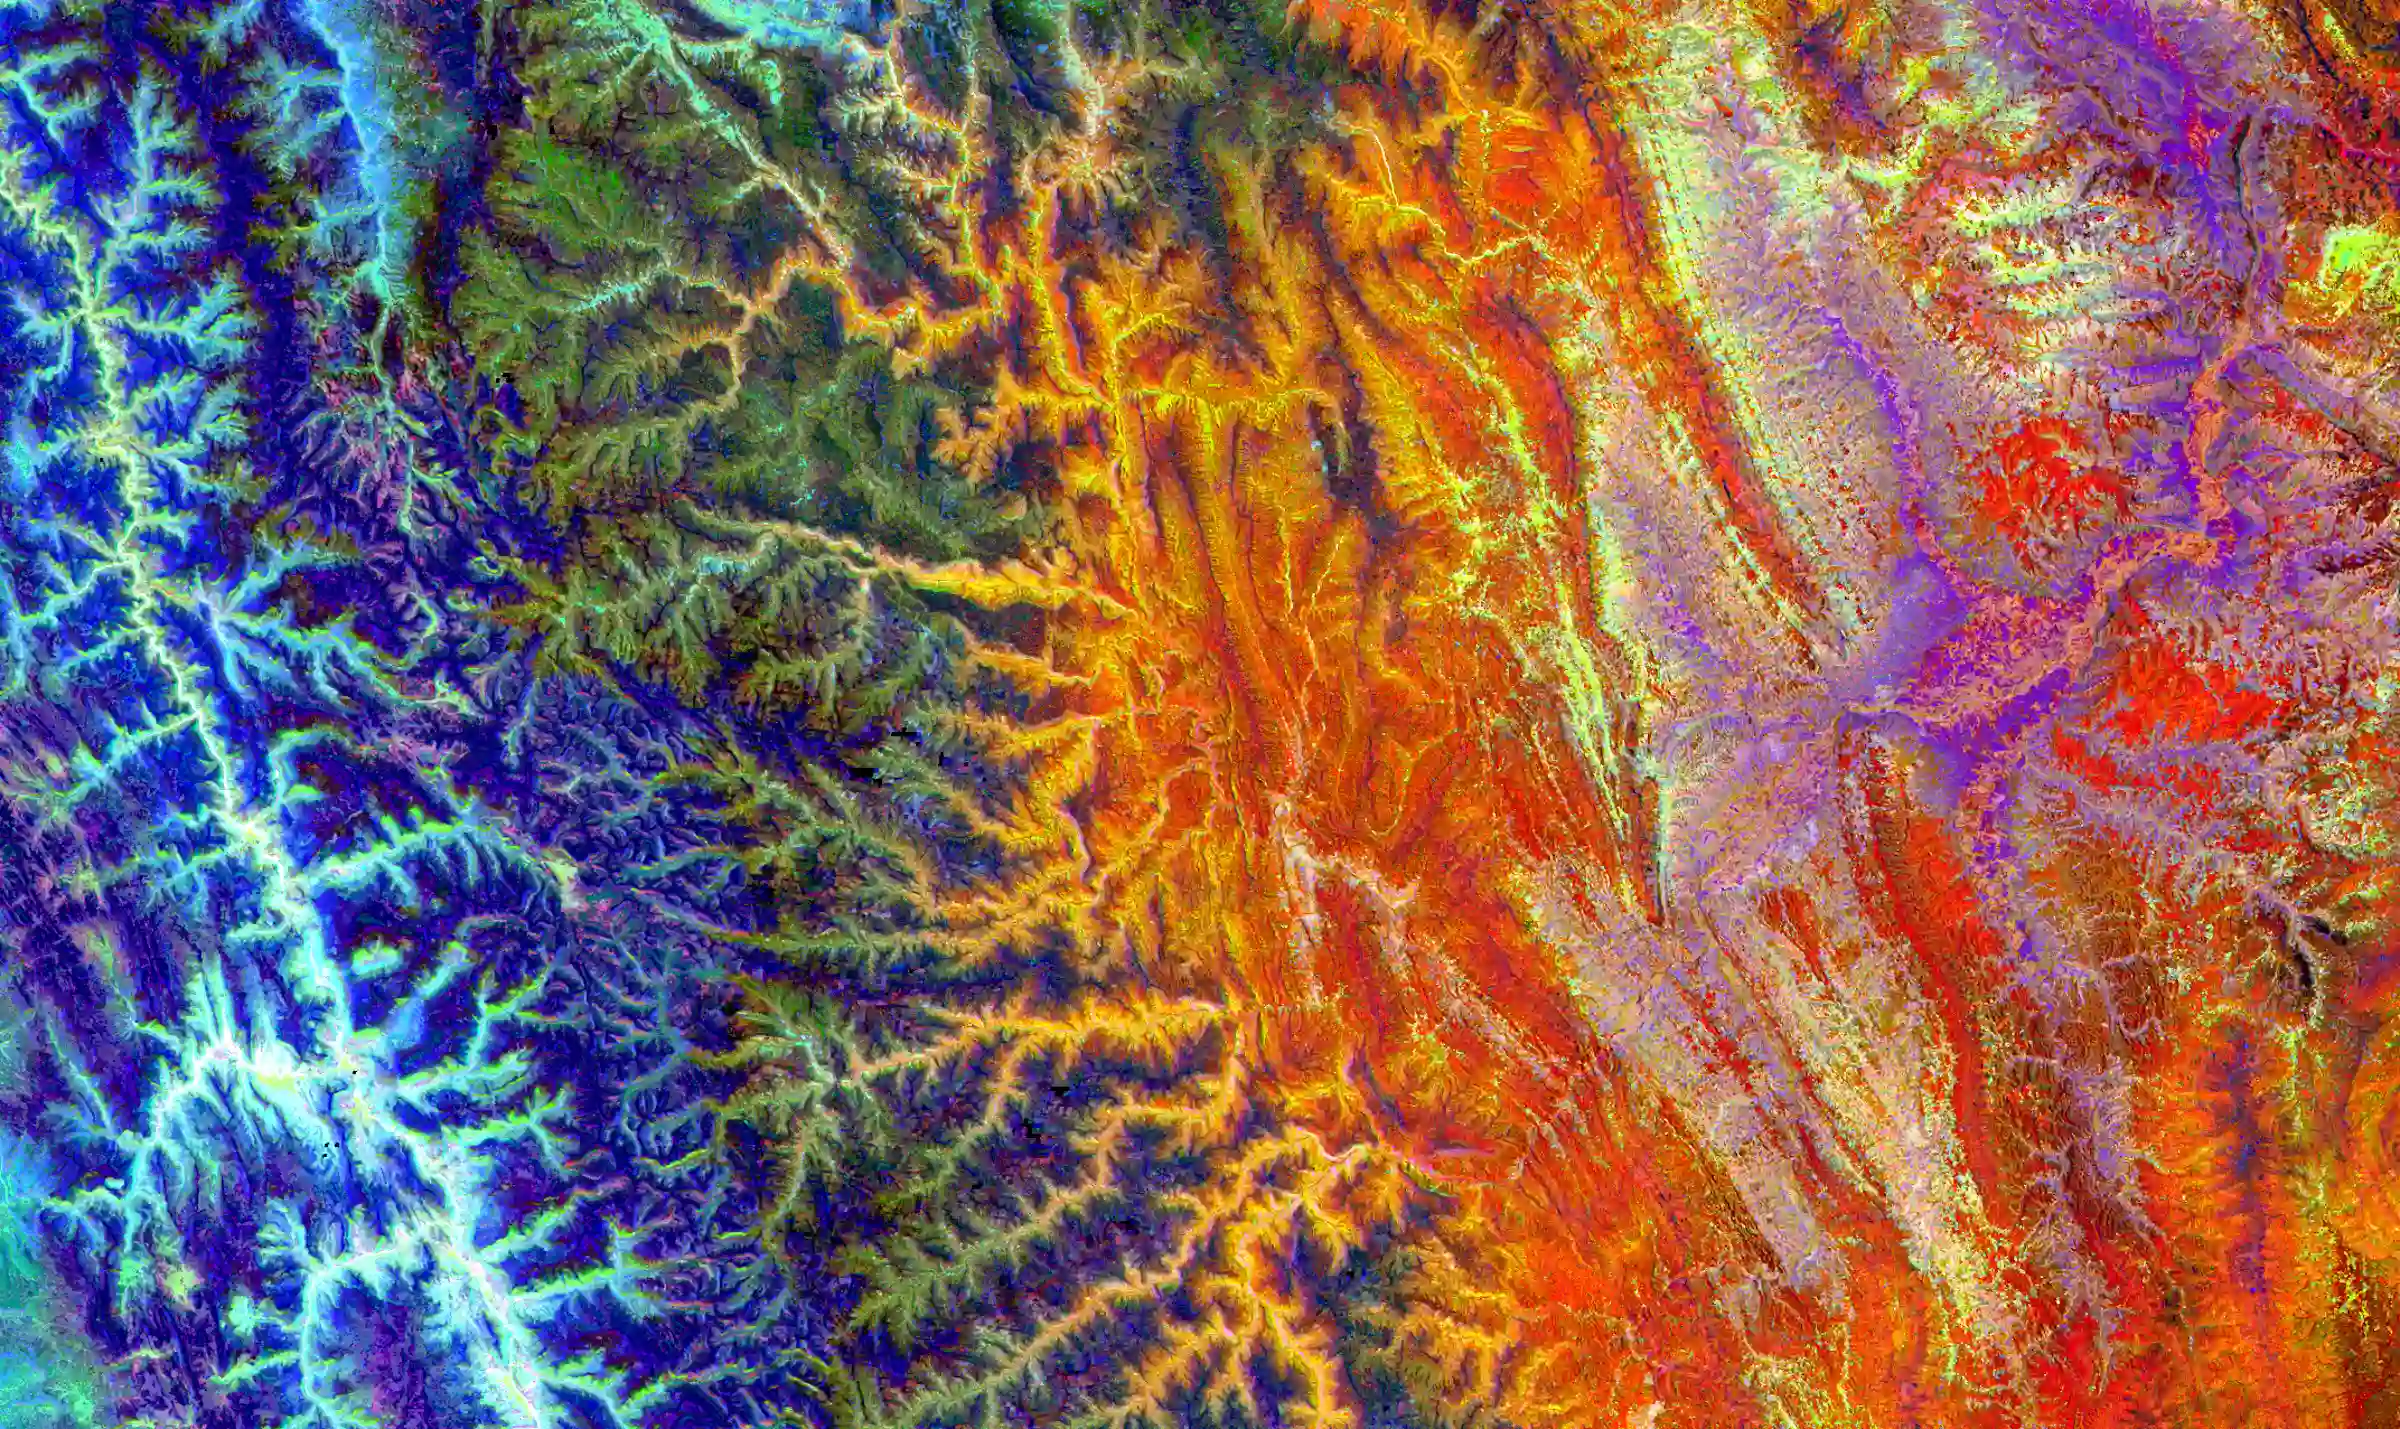
Greg and colleague Dr. Robin Martin are in the far back side of Limahuli Valley on Kauaʻi island. Their field spectrometers are not telling the story that was told to them as students just a decade earlier. That story said all plants have similar chemistries and color. But their instruments reveal nothing but uniqueness among co-existing plant species, each with a different chemistry and spectral signal, despite being "green" to the naked eye. The Spectranomics concept was born in that remote valley on Kauaʻi.
Seeking the Origin of Tropical Plant Chemistry
Deep in Queensland's rainforests, the team builds the foundation of Spectronomics from the ground up — literally. Handheld spectrometers pressed to leaves. Canopy samples cataloged. The painstaking work of matching chemistry to species, one tree at a time. Before you can see biodiversity from the air, you have to know what you're looking for.
Engineering CAO
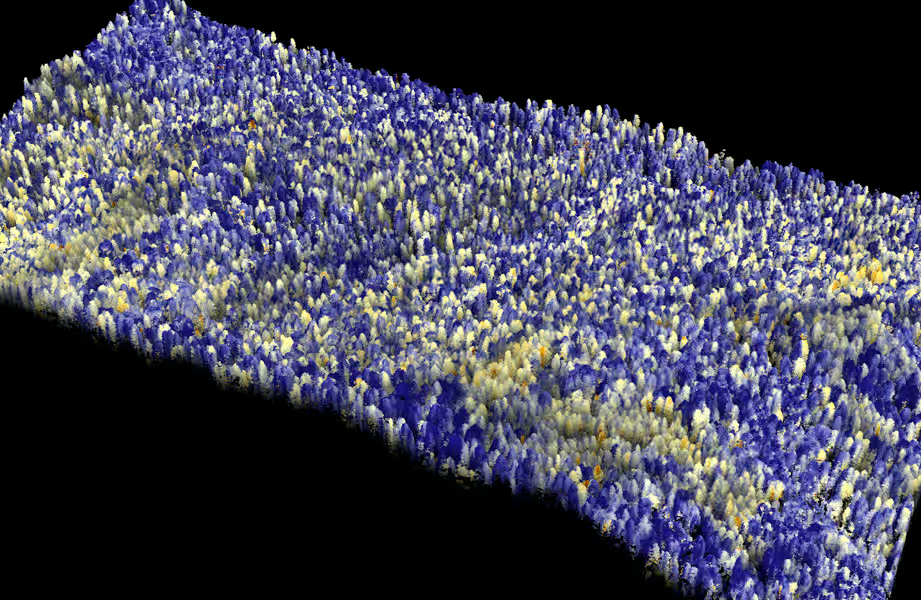
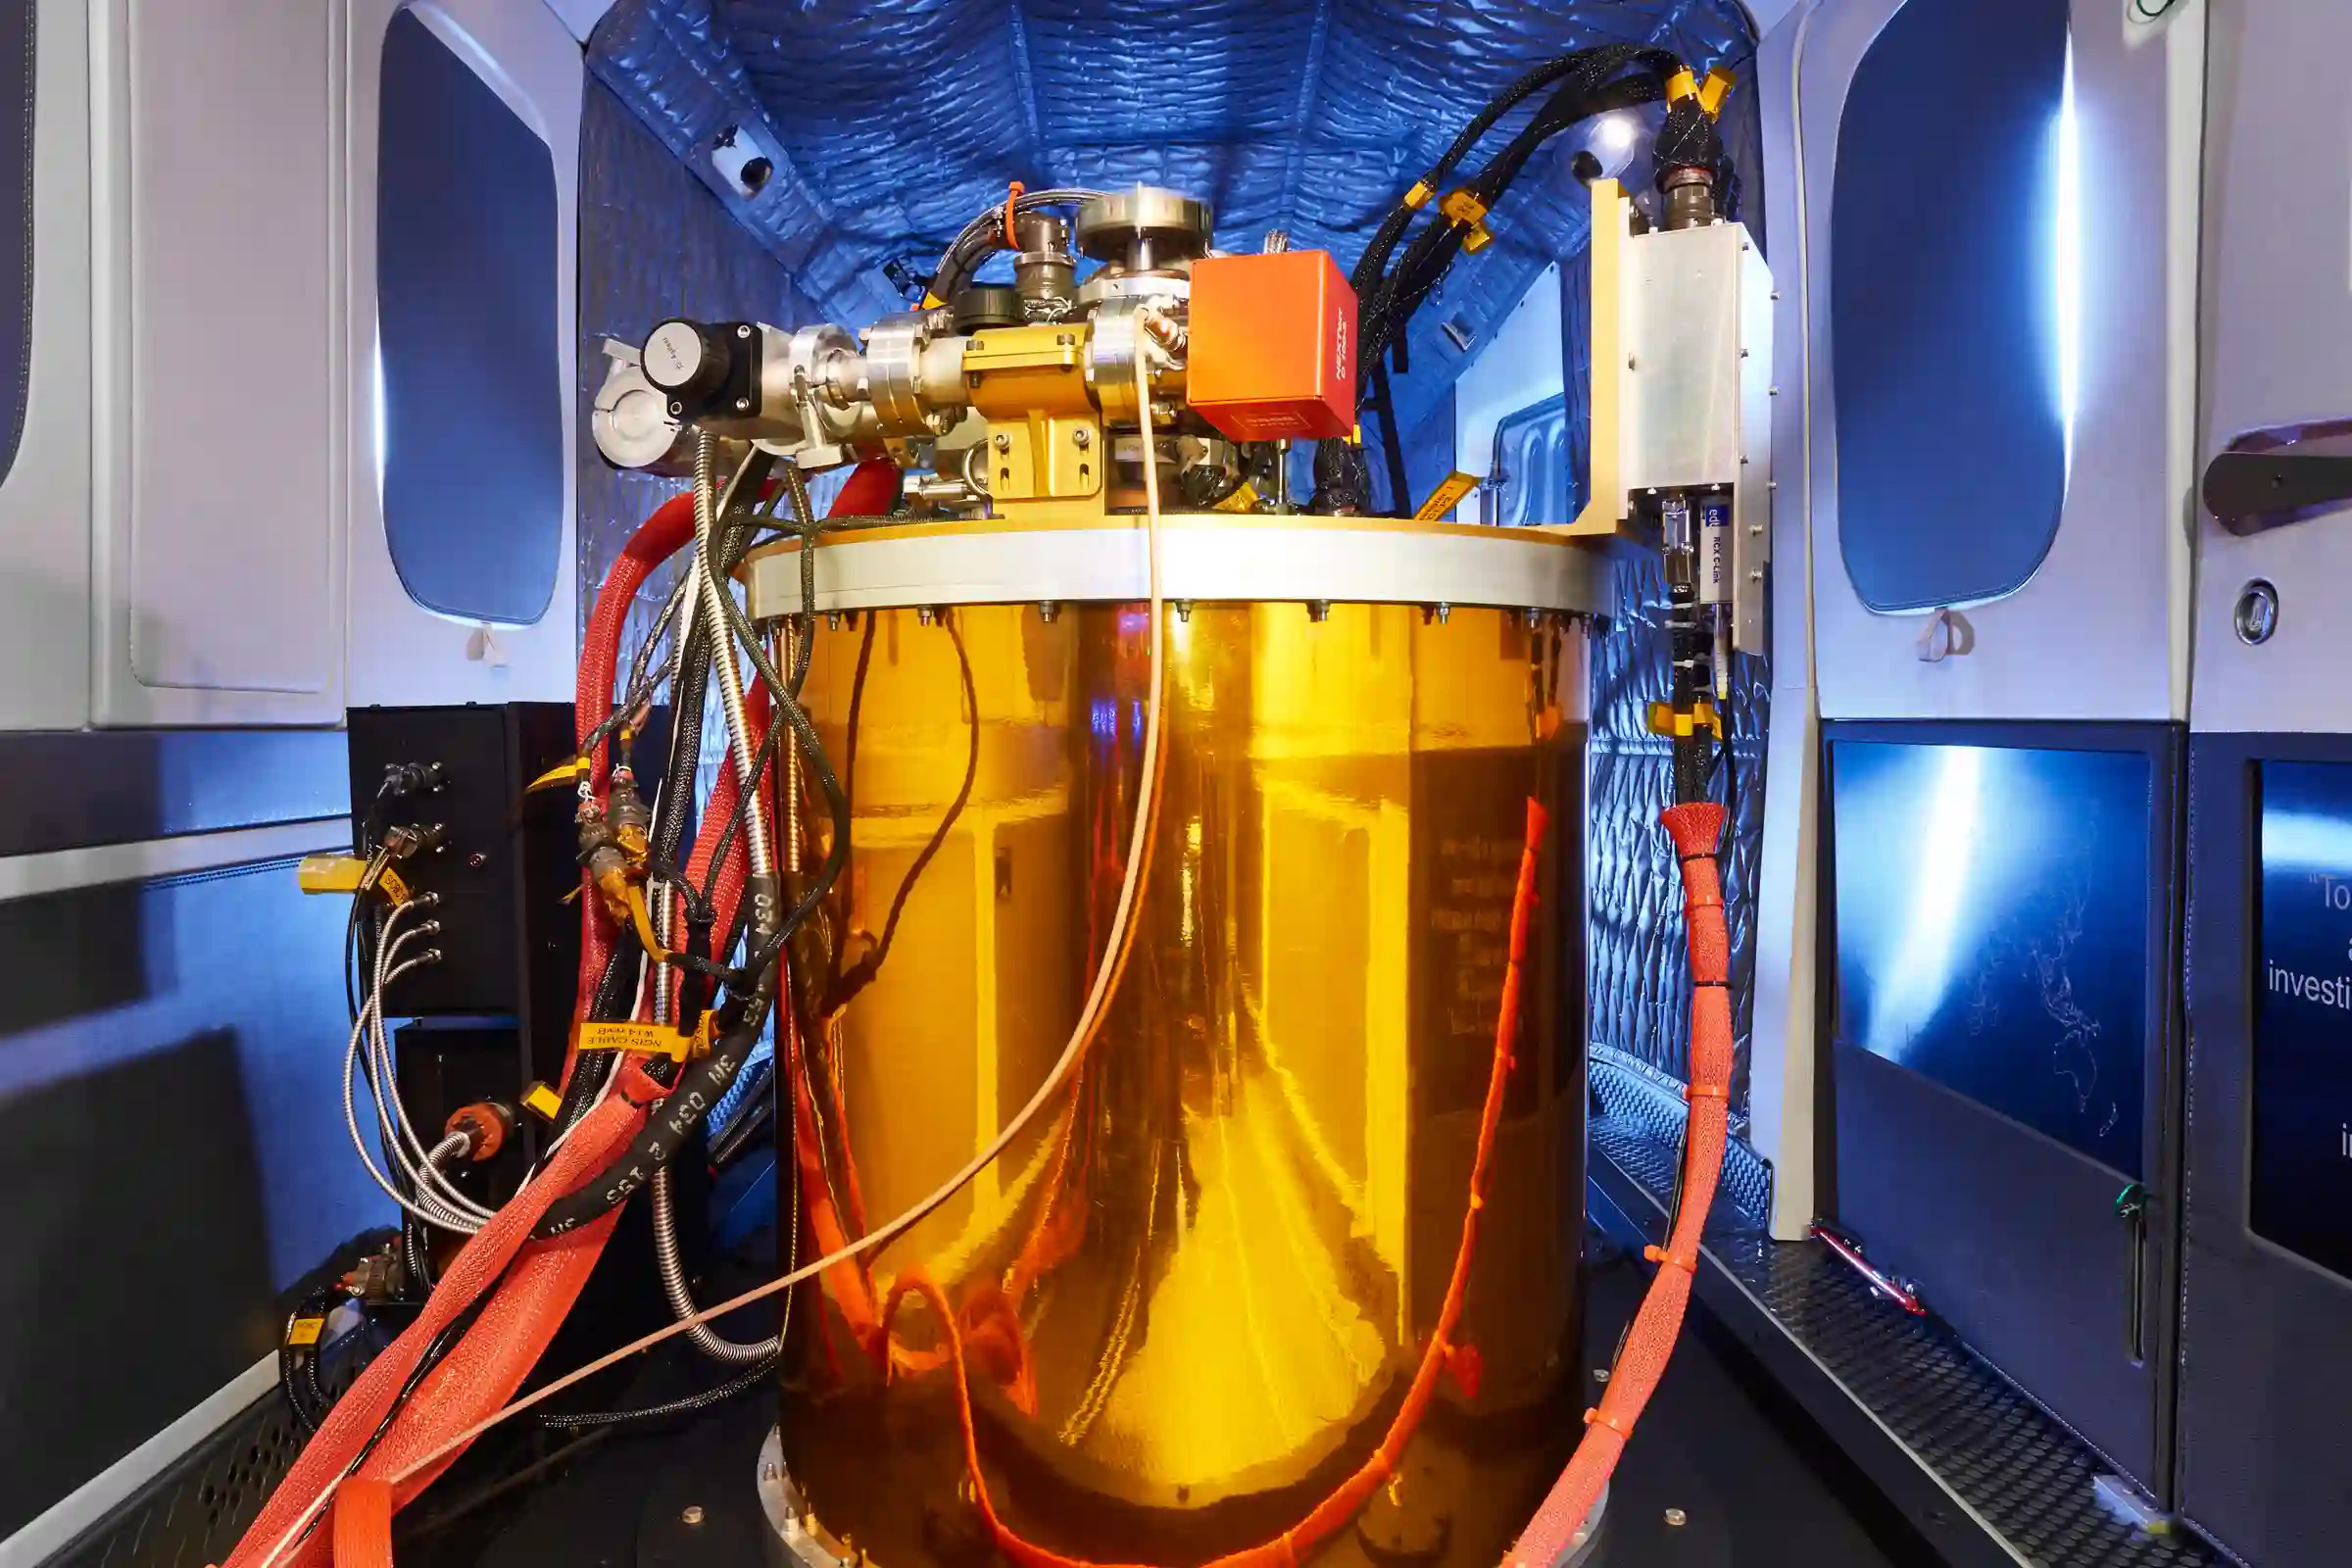
Greg and team have defined the specifications for a new airborne sensor package to probe the 3D structure and chemistry of ecosystems. They collect up engineering talent in the U.S. and Canada. The stakes are high but the funding is solid from the W.M. Keck Foundation and William R. Hearst III. They are setting course for an all new era in conservation mapping.
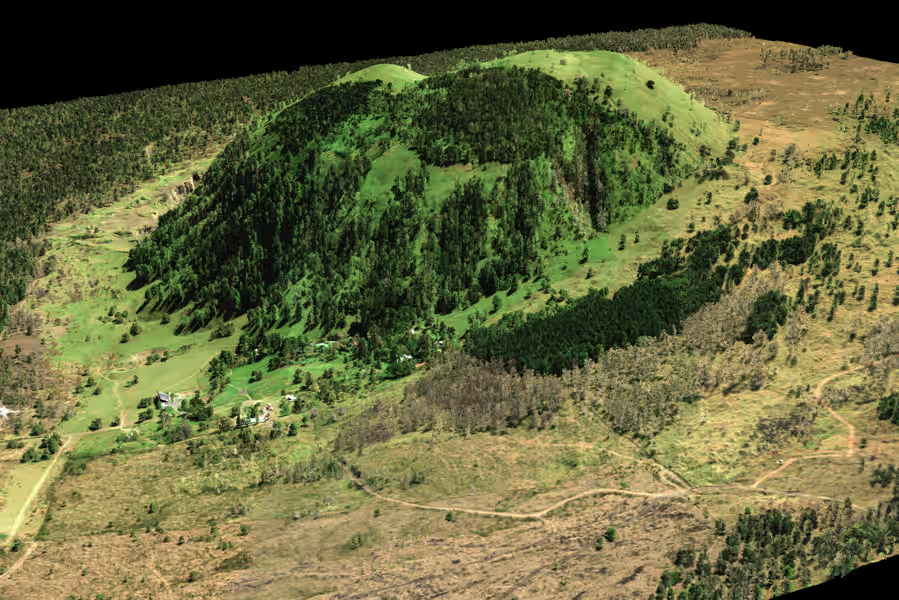
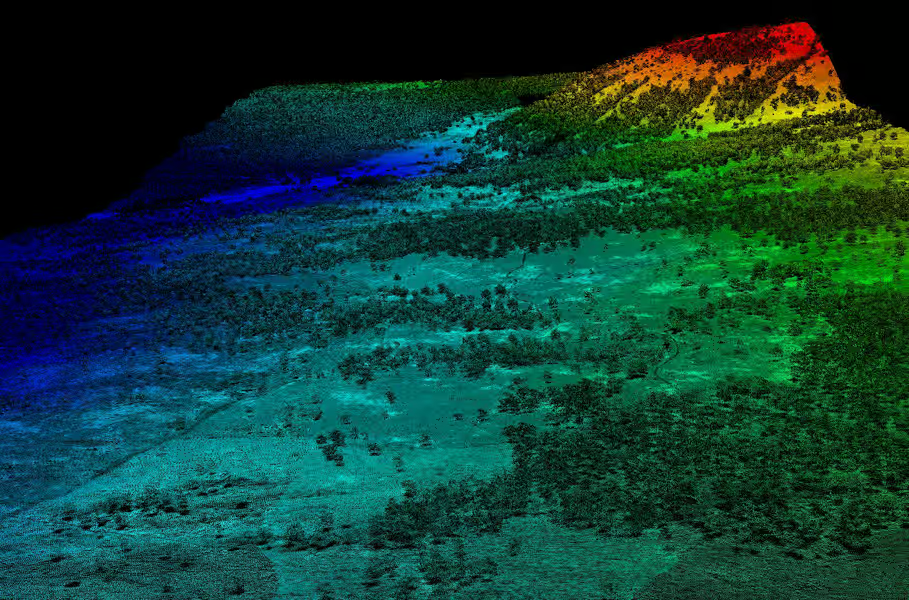
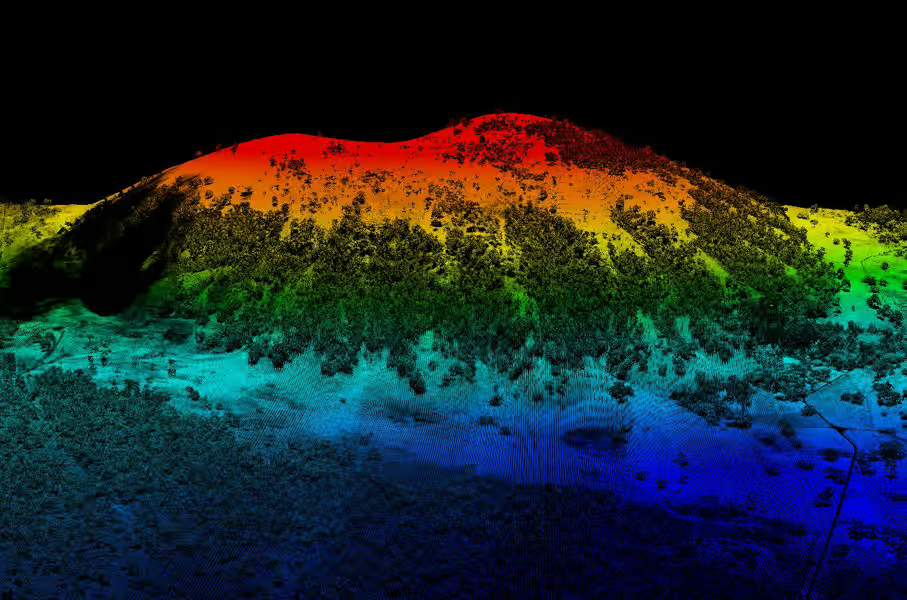
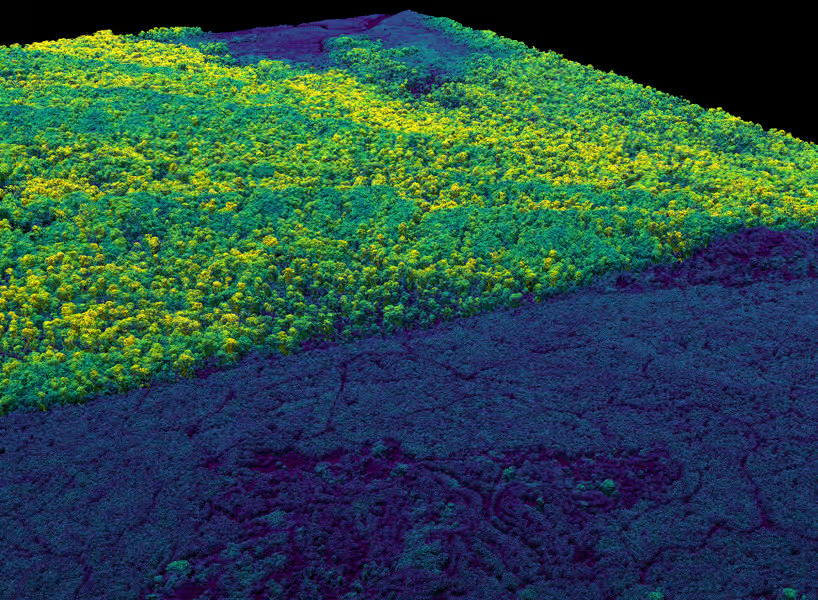
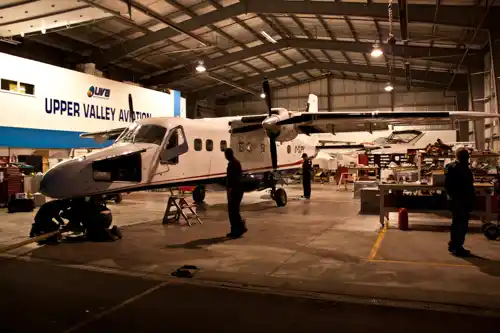
Building CAO
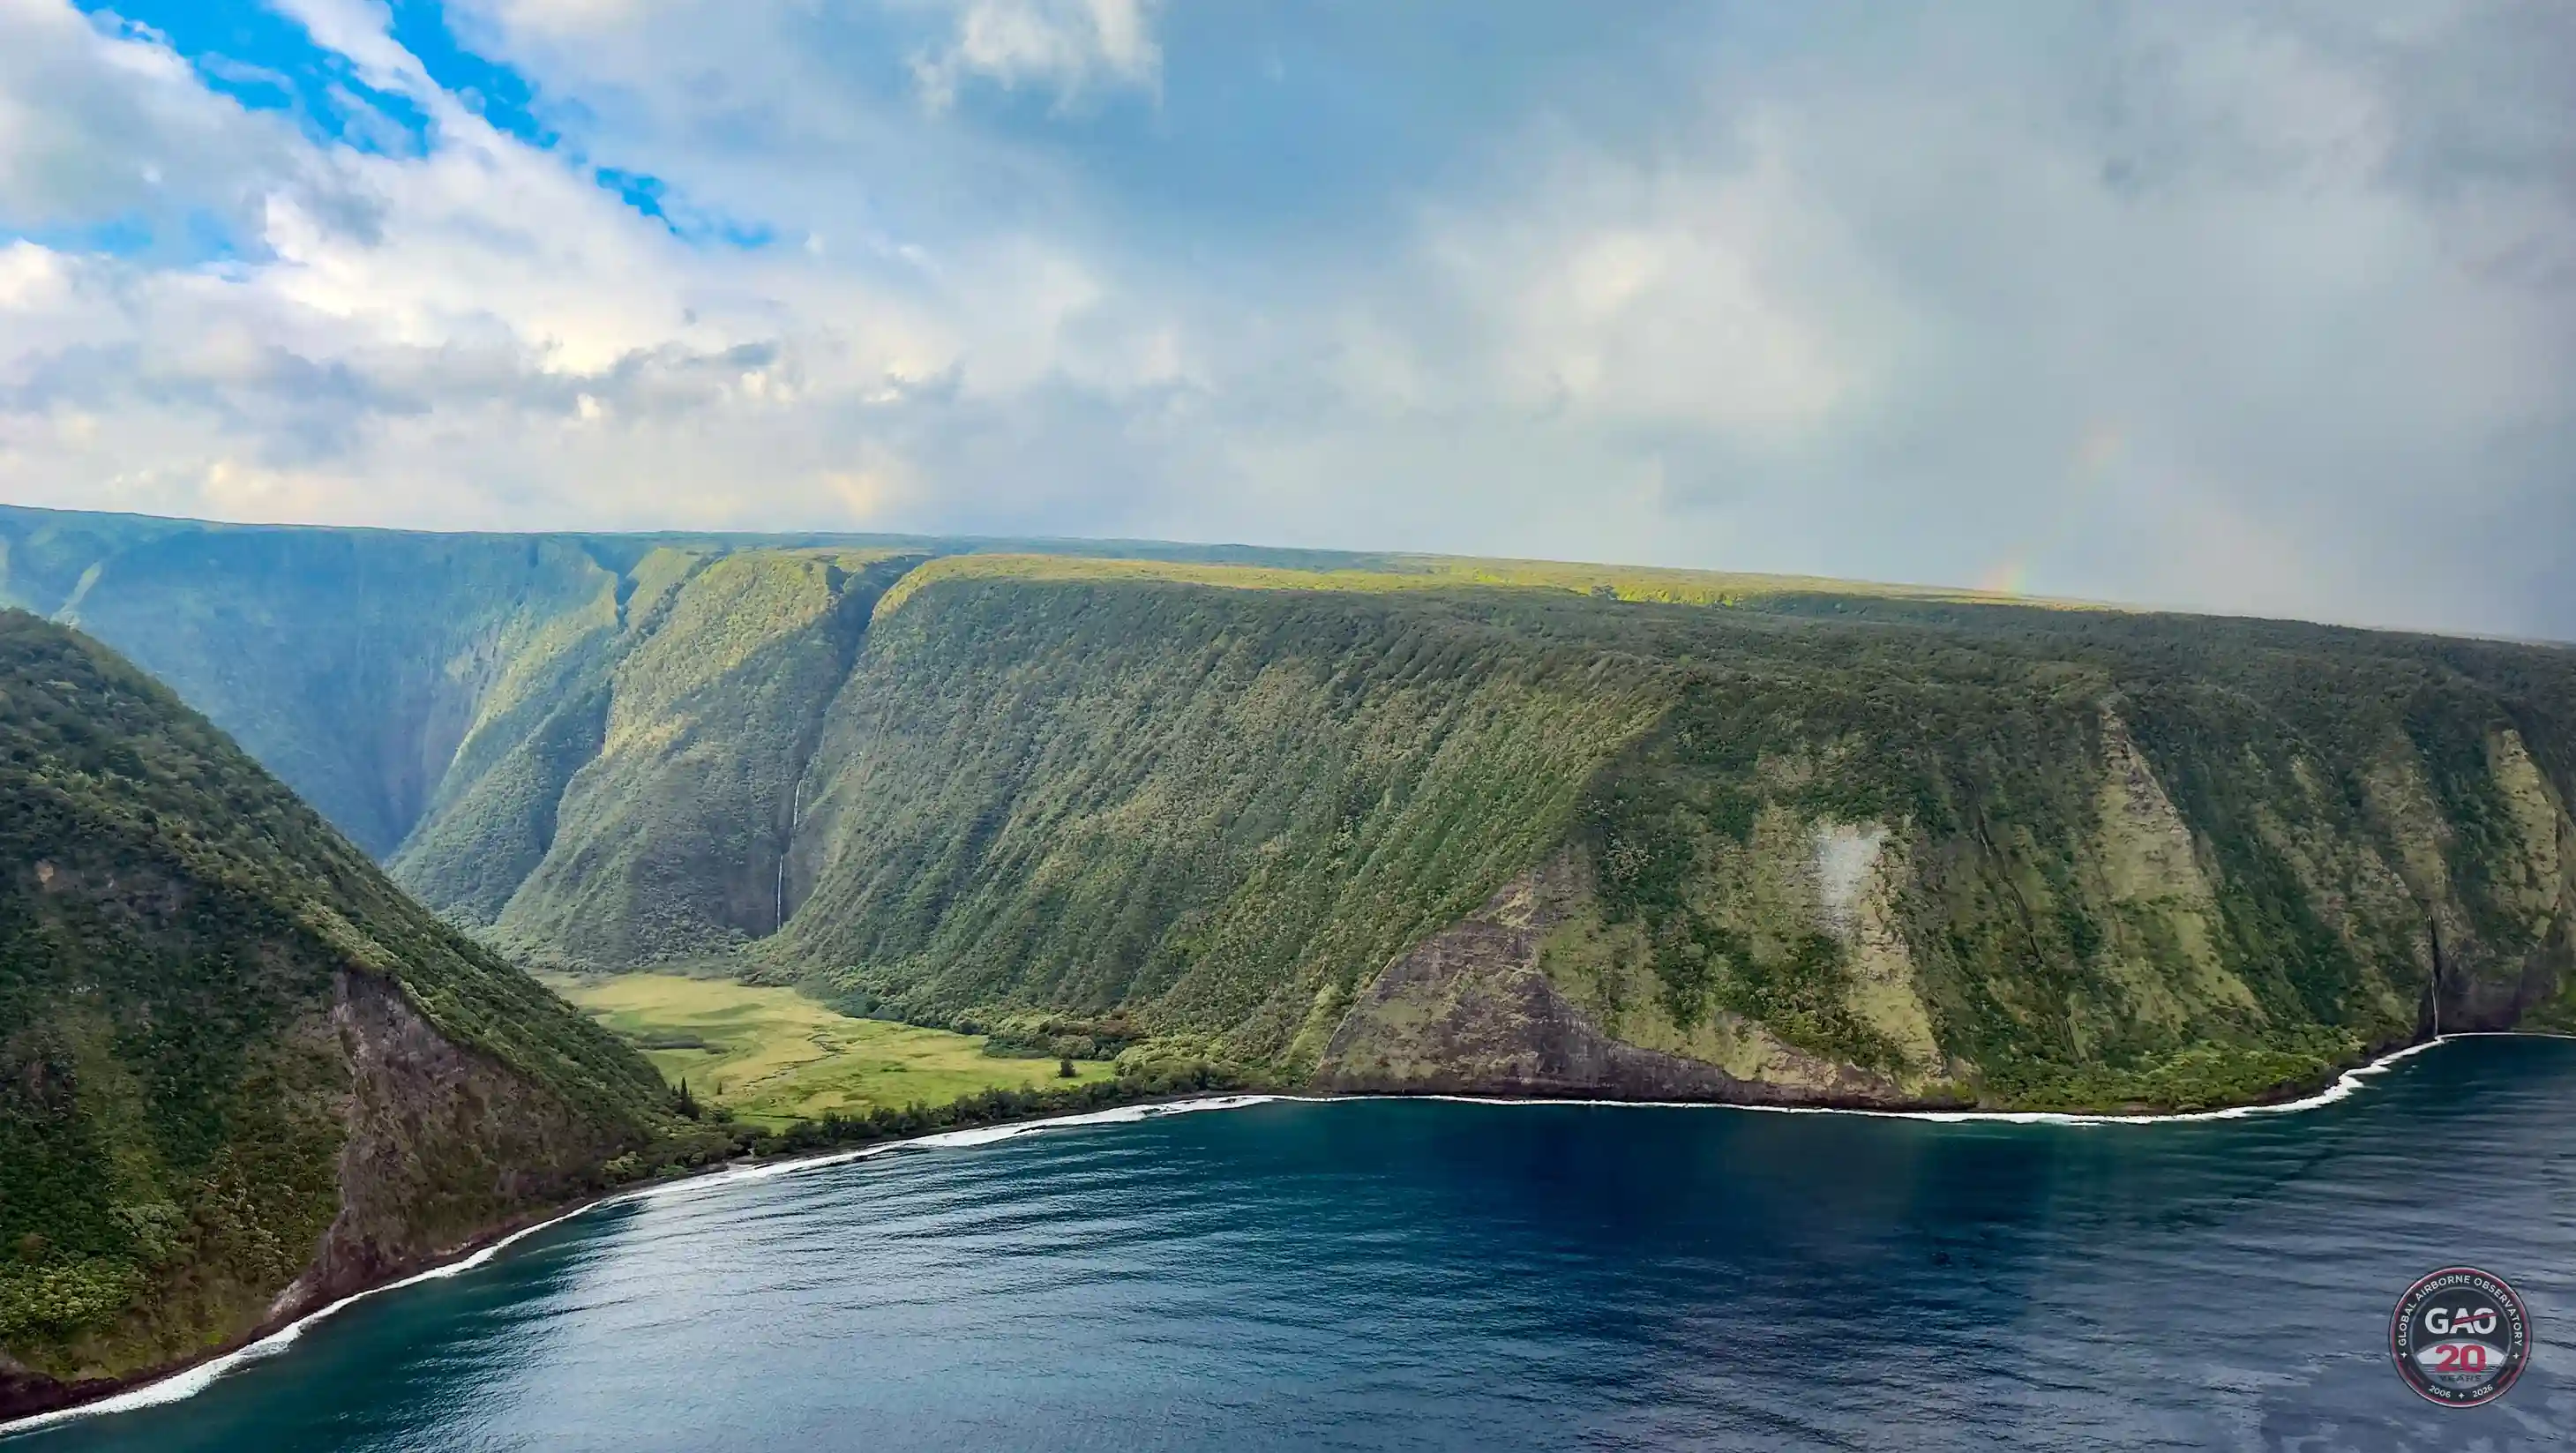
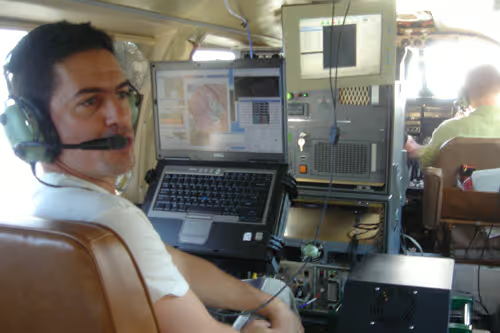
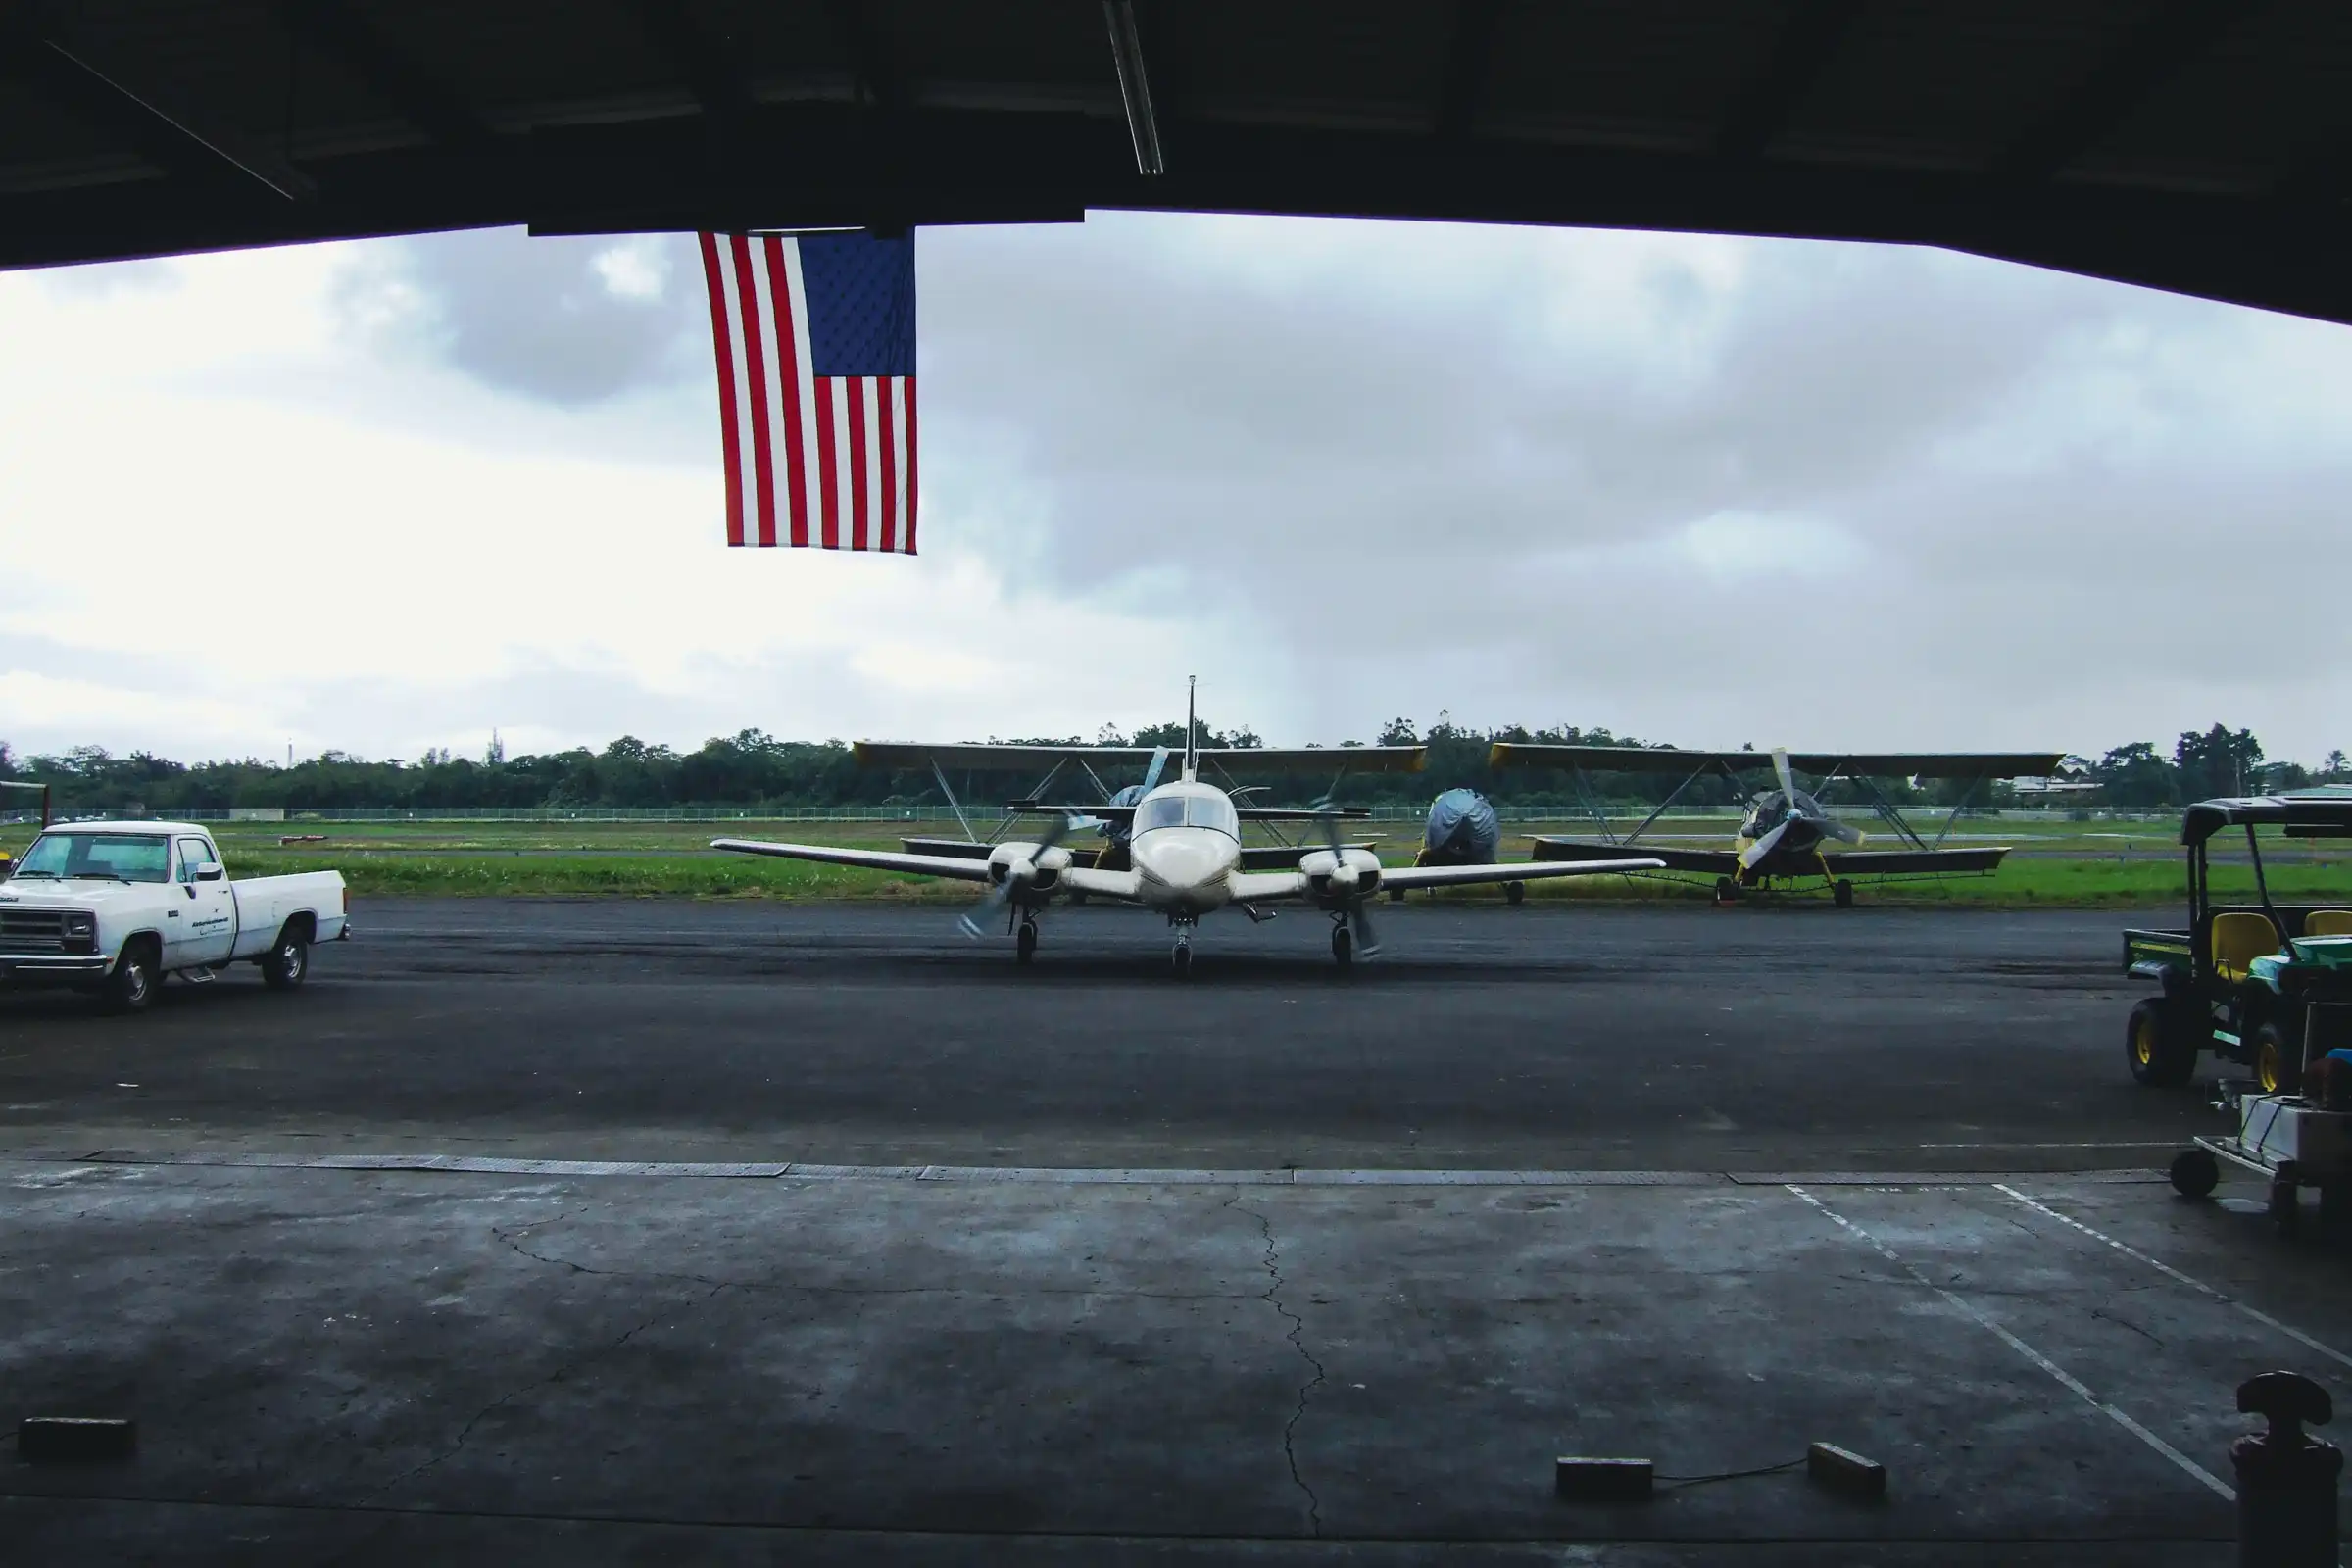
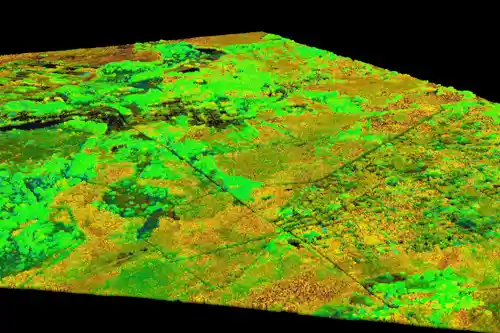
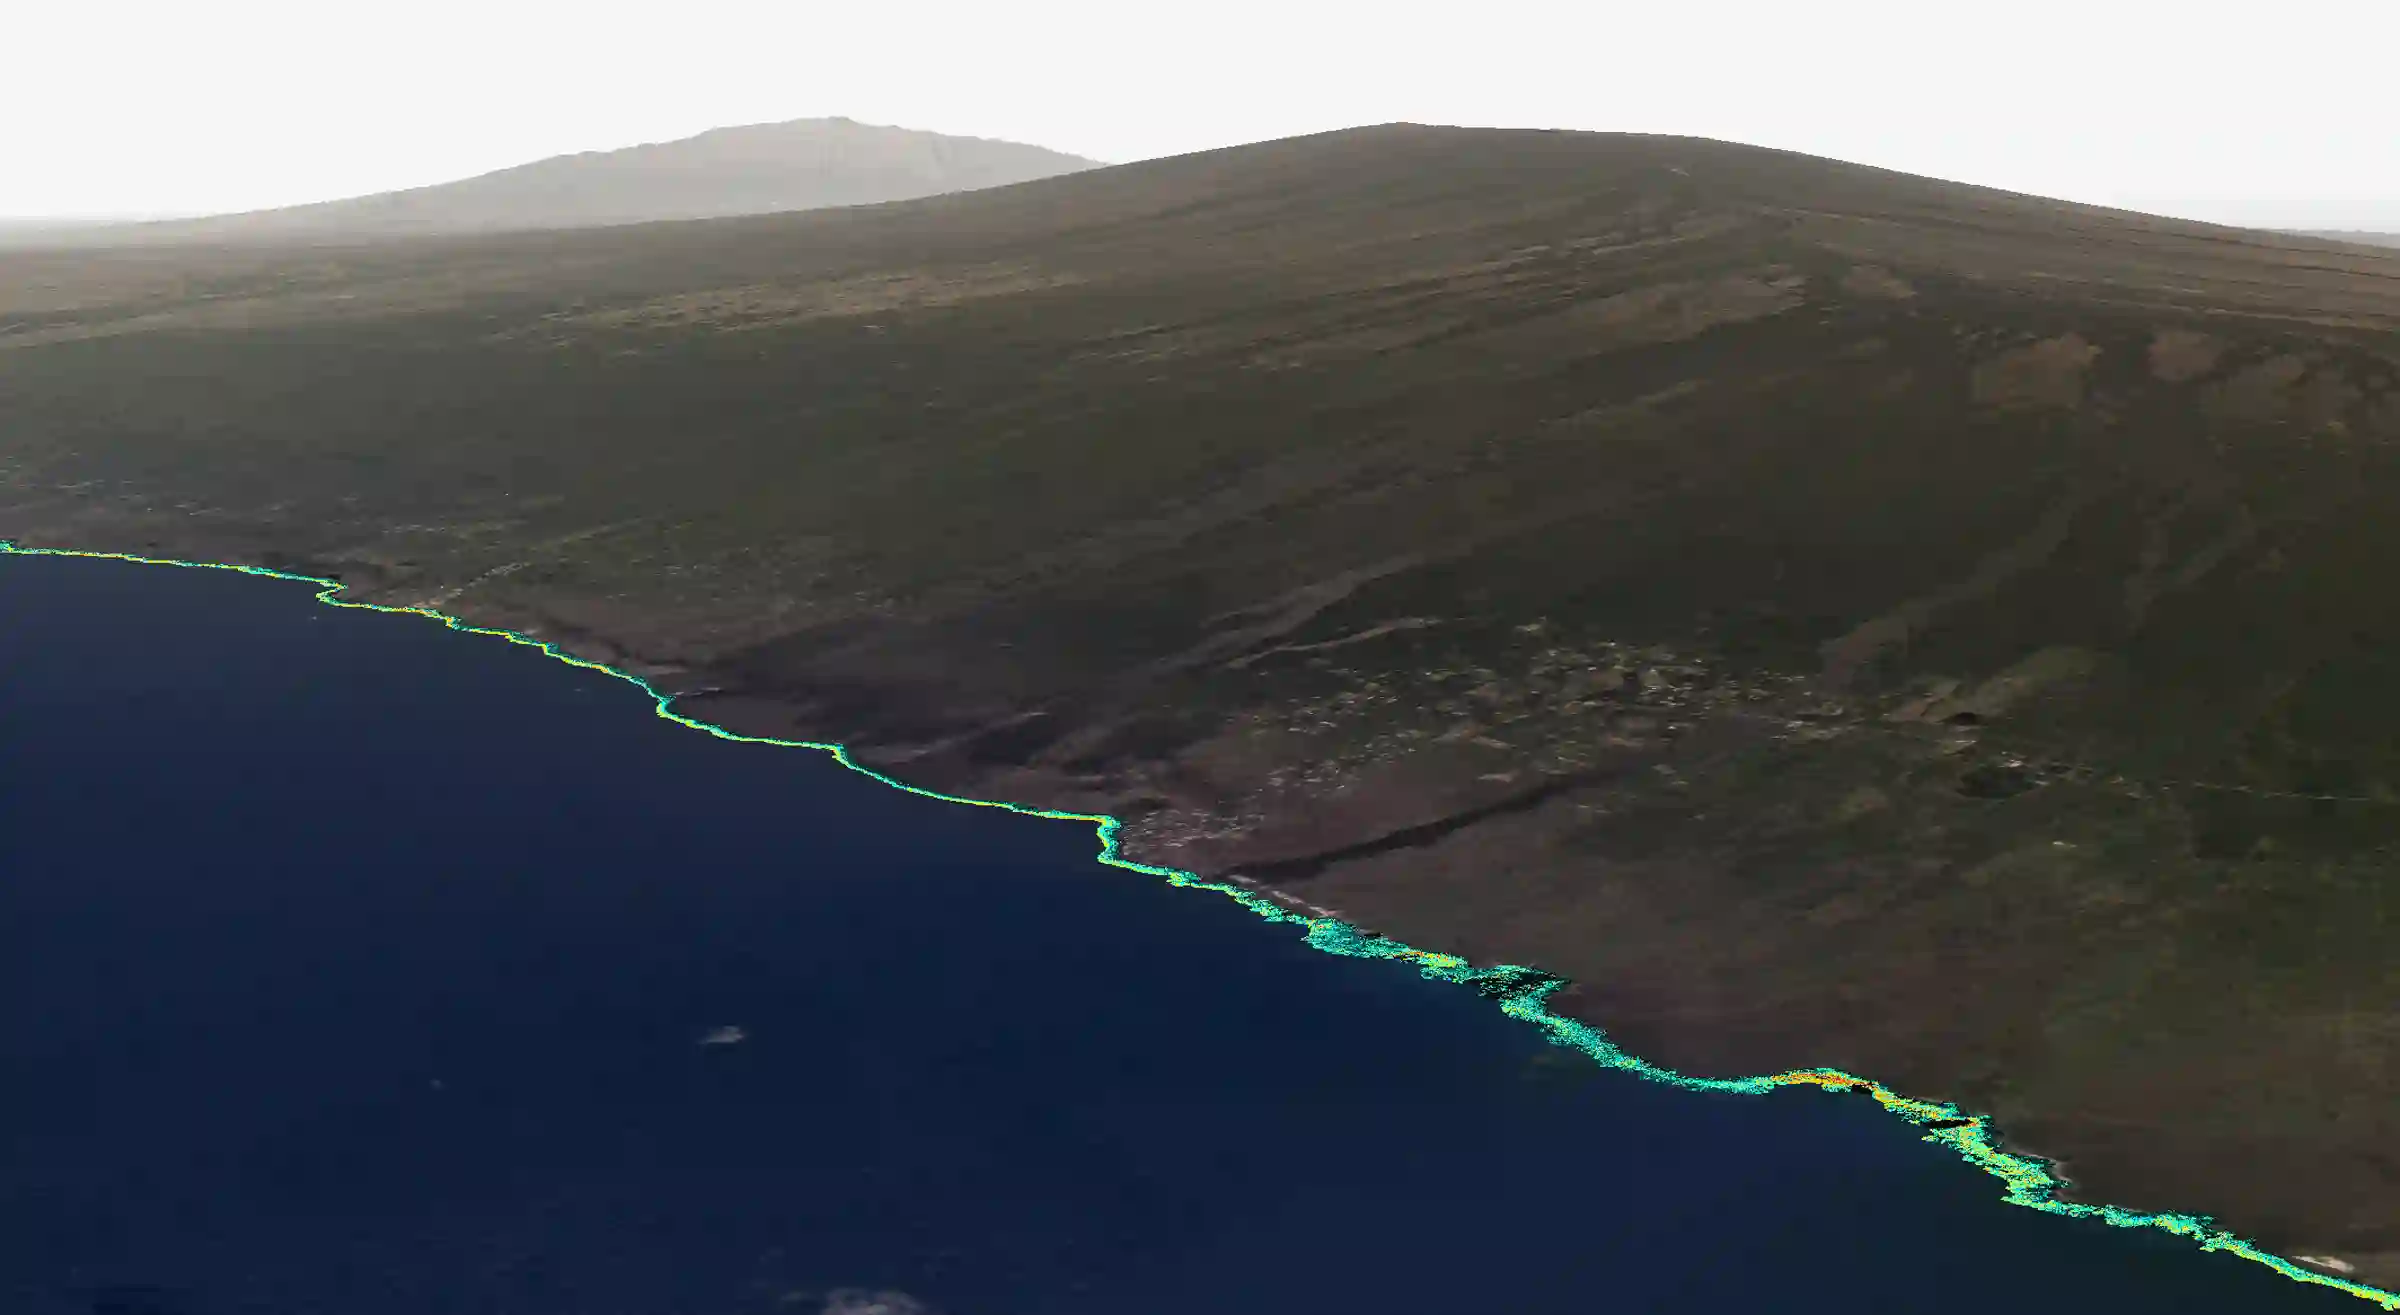
Home in Hilo, Hawaii, the team finalizes the new instrument package, custom software, and computers to take a stab at 3D mapping of forests on Hawaiʻi Island. Never before achieved, they use a tiny Piper Navajo, careening between the massive slopes of Mauna Loa and Mauna Kea volcanoes. They finally get the system to work over an iconic volcanic cinder cone known as PuʻuWaʻawaʻa. The image makes the front page of the Honolulu newspaper days later.
CAO-1 Launches
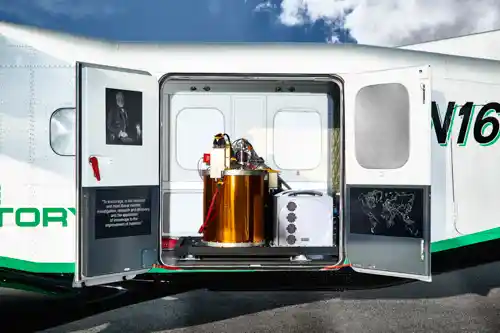
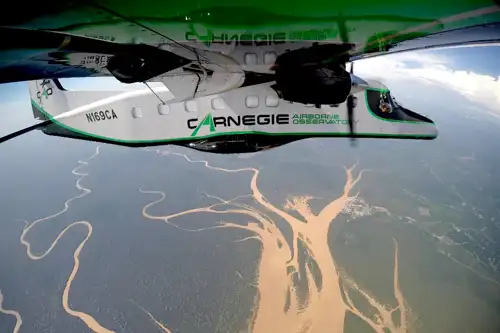
The Carnegie Airborne Observatory launches its first generation. A compact Visible-to-Near-Infrared imaging spectrometer paired with a simple LiDAR, fitted into a Piper Navajo aircraft. Funded by the W.M. Keck Foundation and William R. Hearst III. The team is just three people.
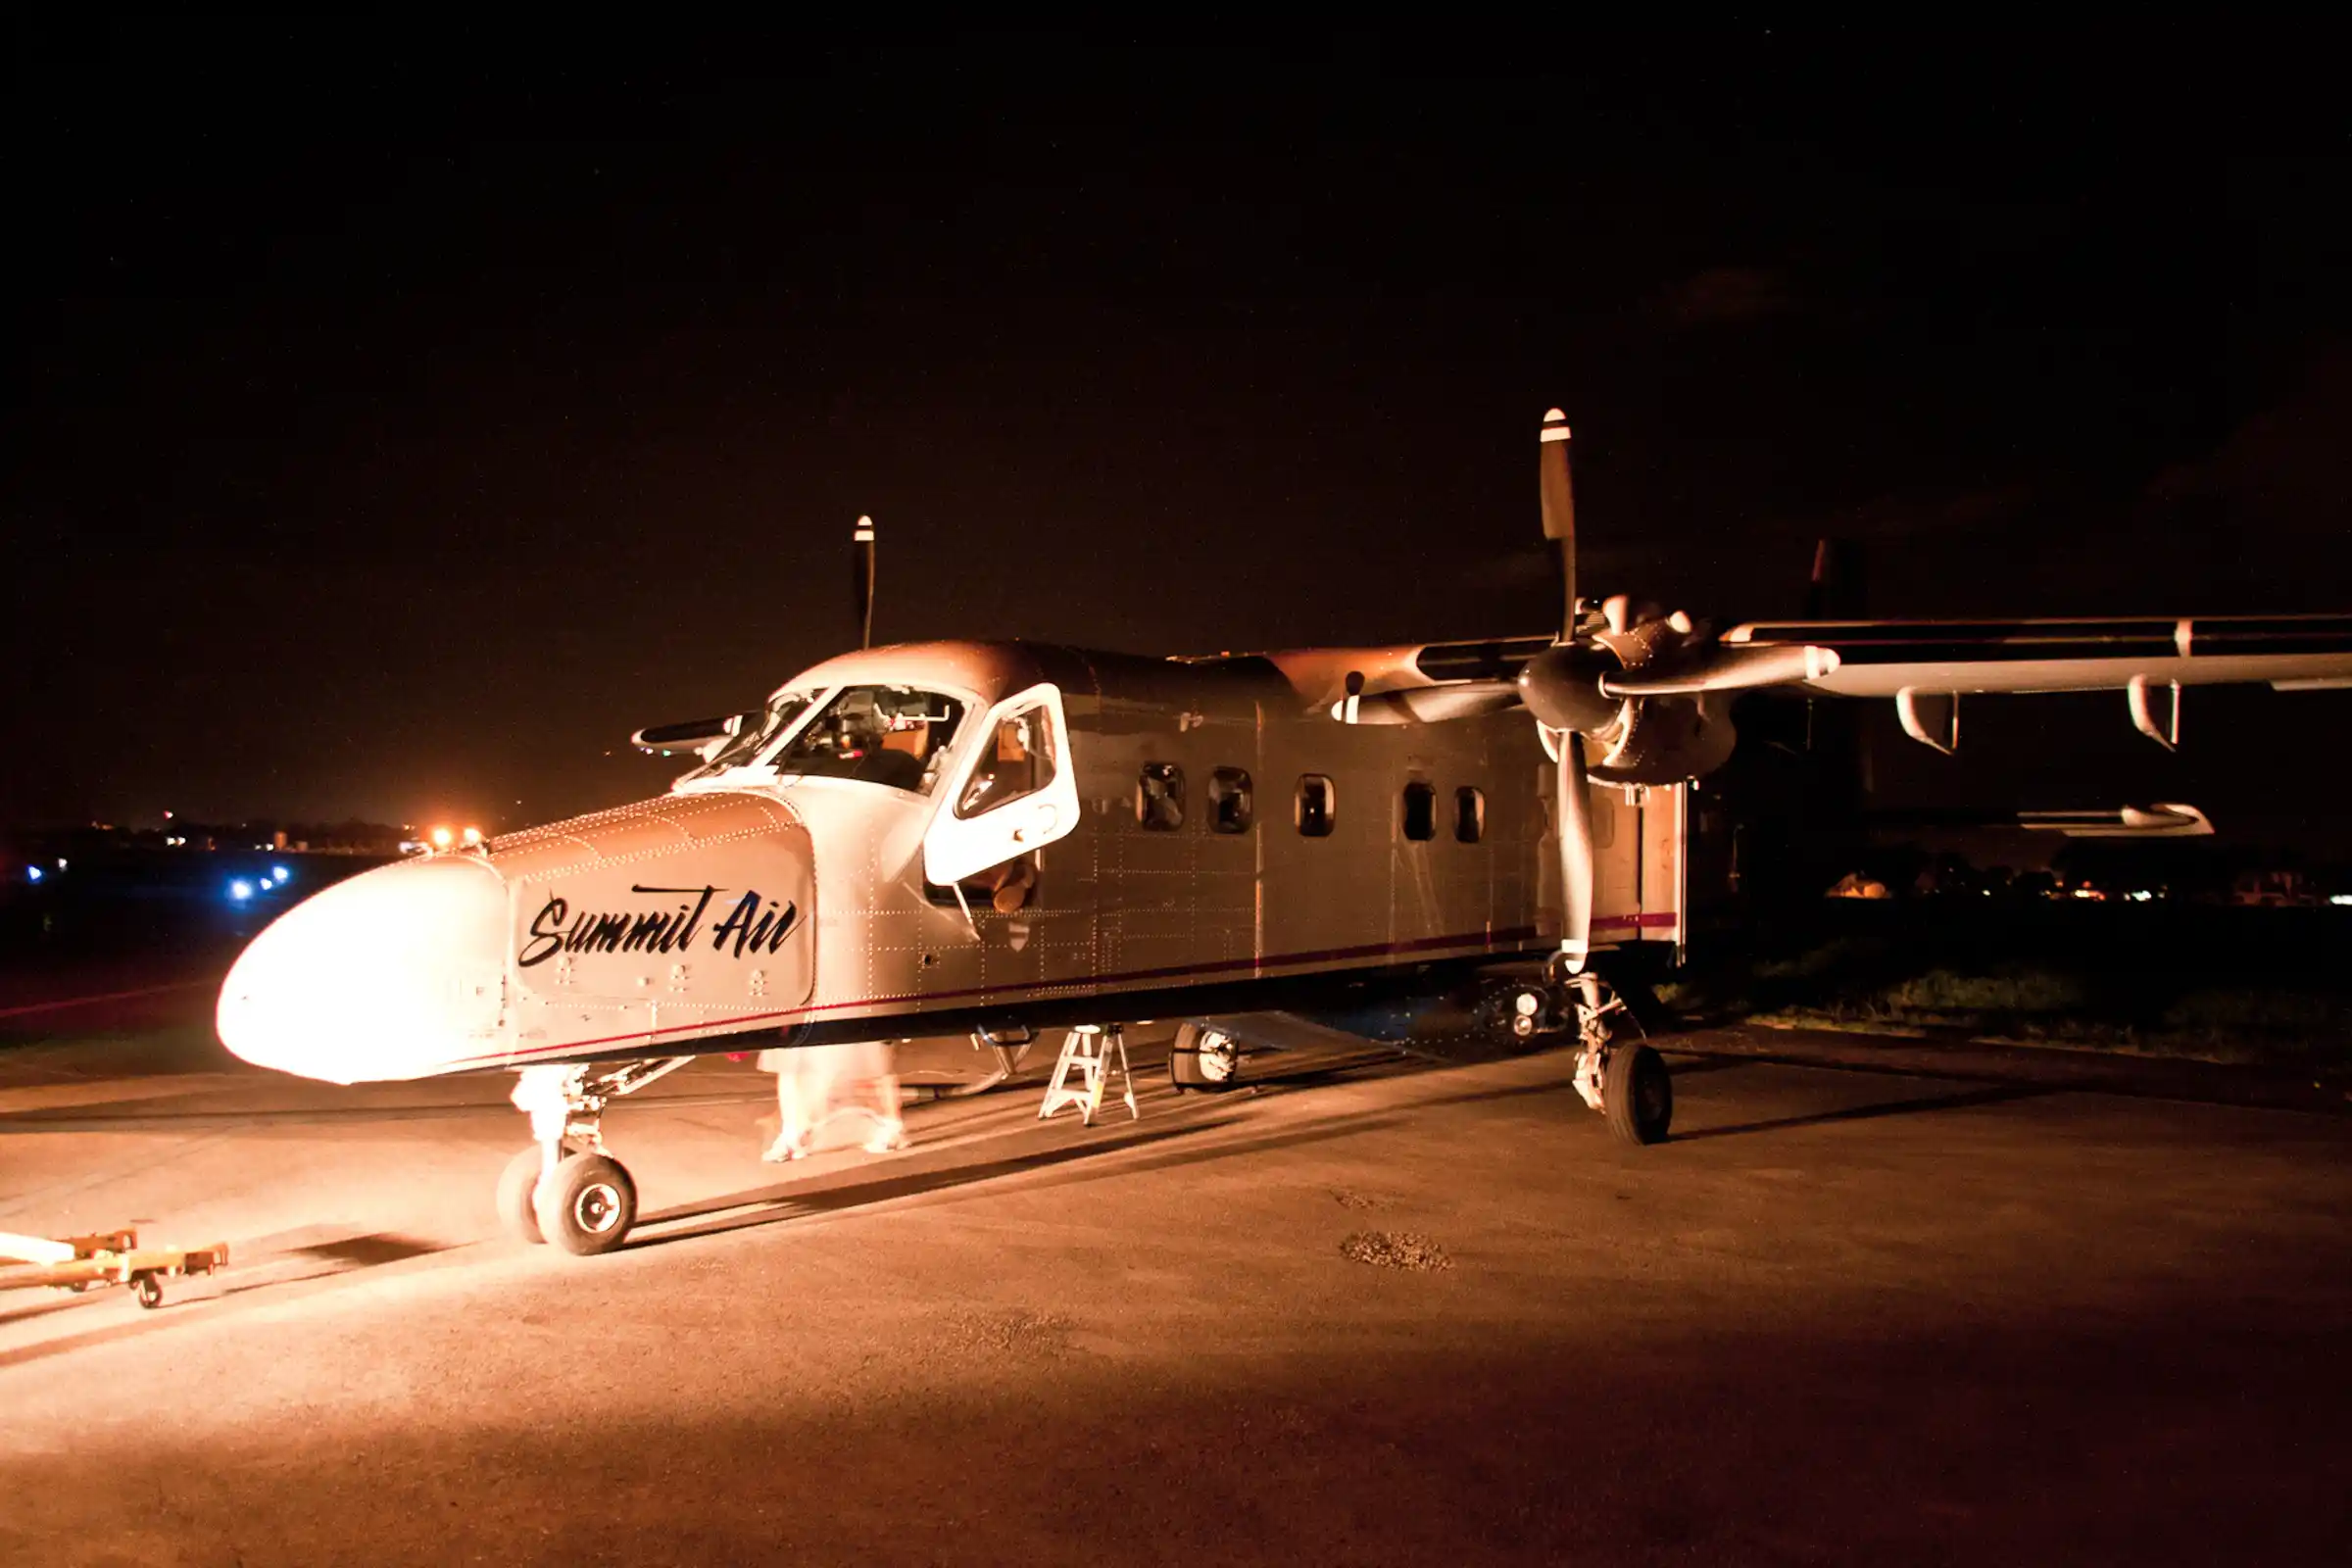
CAO Beta: Second Generation Takes Flight
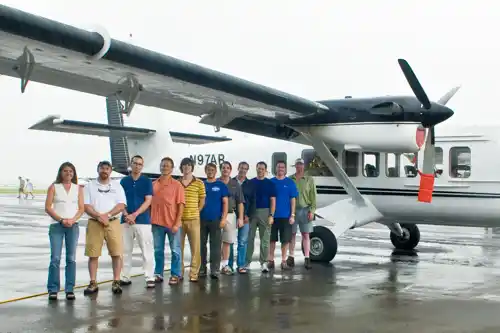
The Carnegie Airborne Observatory evolves. CAO Beta deploys aboard a Twin Otter aircraft with expanded sensor payload provided by the Jet Propulsion Laboratory with improved spectral resolution. More machinery, more range, more data. The Beta phase proves the technology can scale beyond proof-of-concept — setting the stage for the major leap to come.
Transition from experimental to operational platform
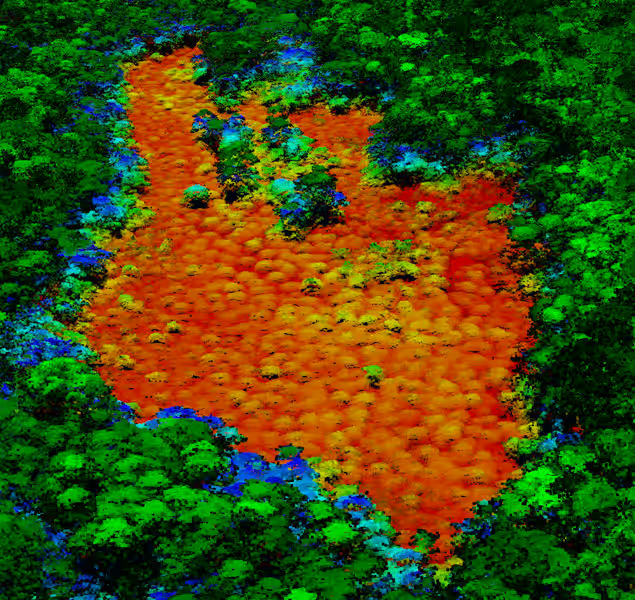
First Carbon
Working with collaborators from the U.S. Forest Service, the CAO team flys and reflys the eastern flank of Mauna Kea volcano, where native tropical forests contain abundant species and high level of stored carbon. This is their testing ground for a new approach to mapping carbon stocks using airborne lasers and spectrometers.
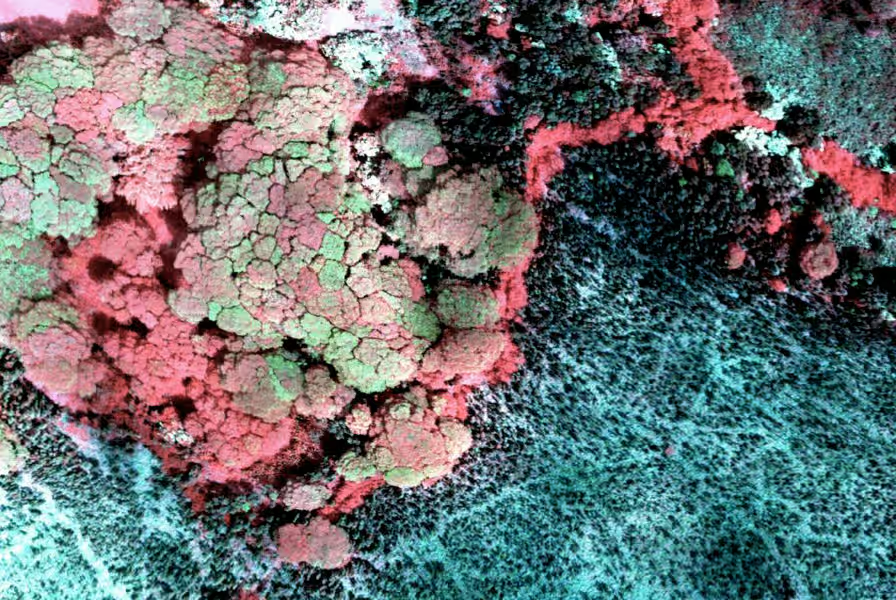
Adding More Chemistry
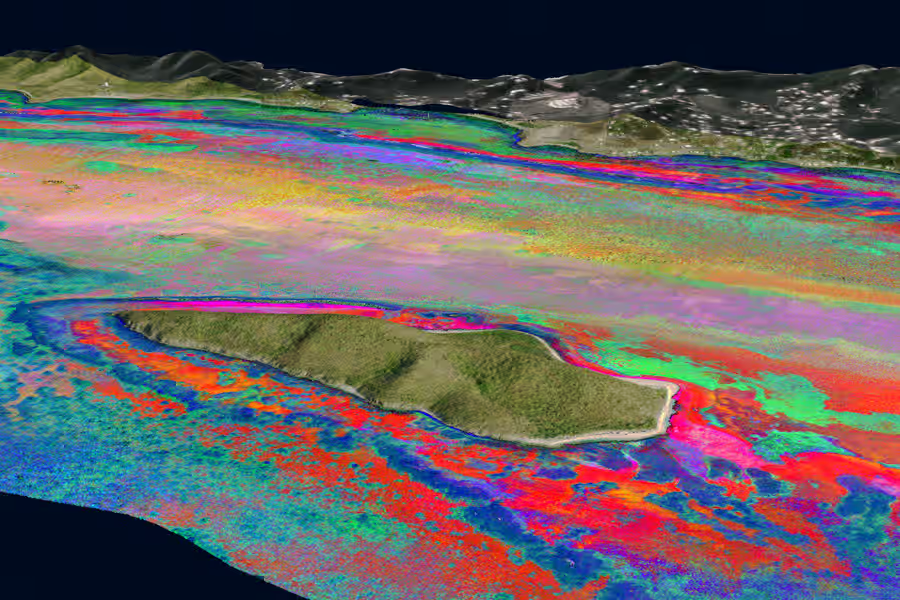
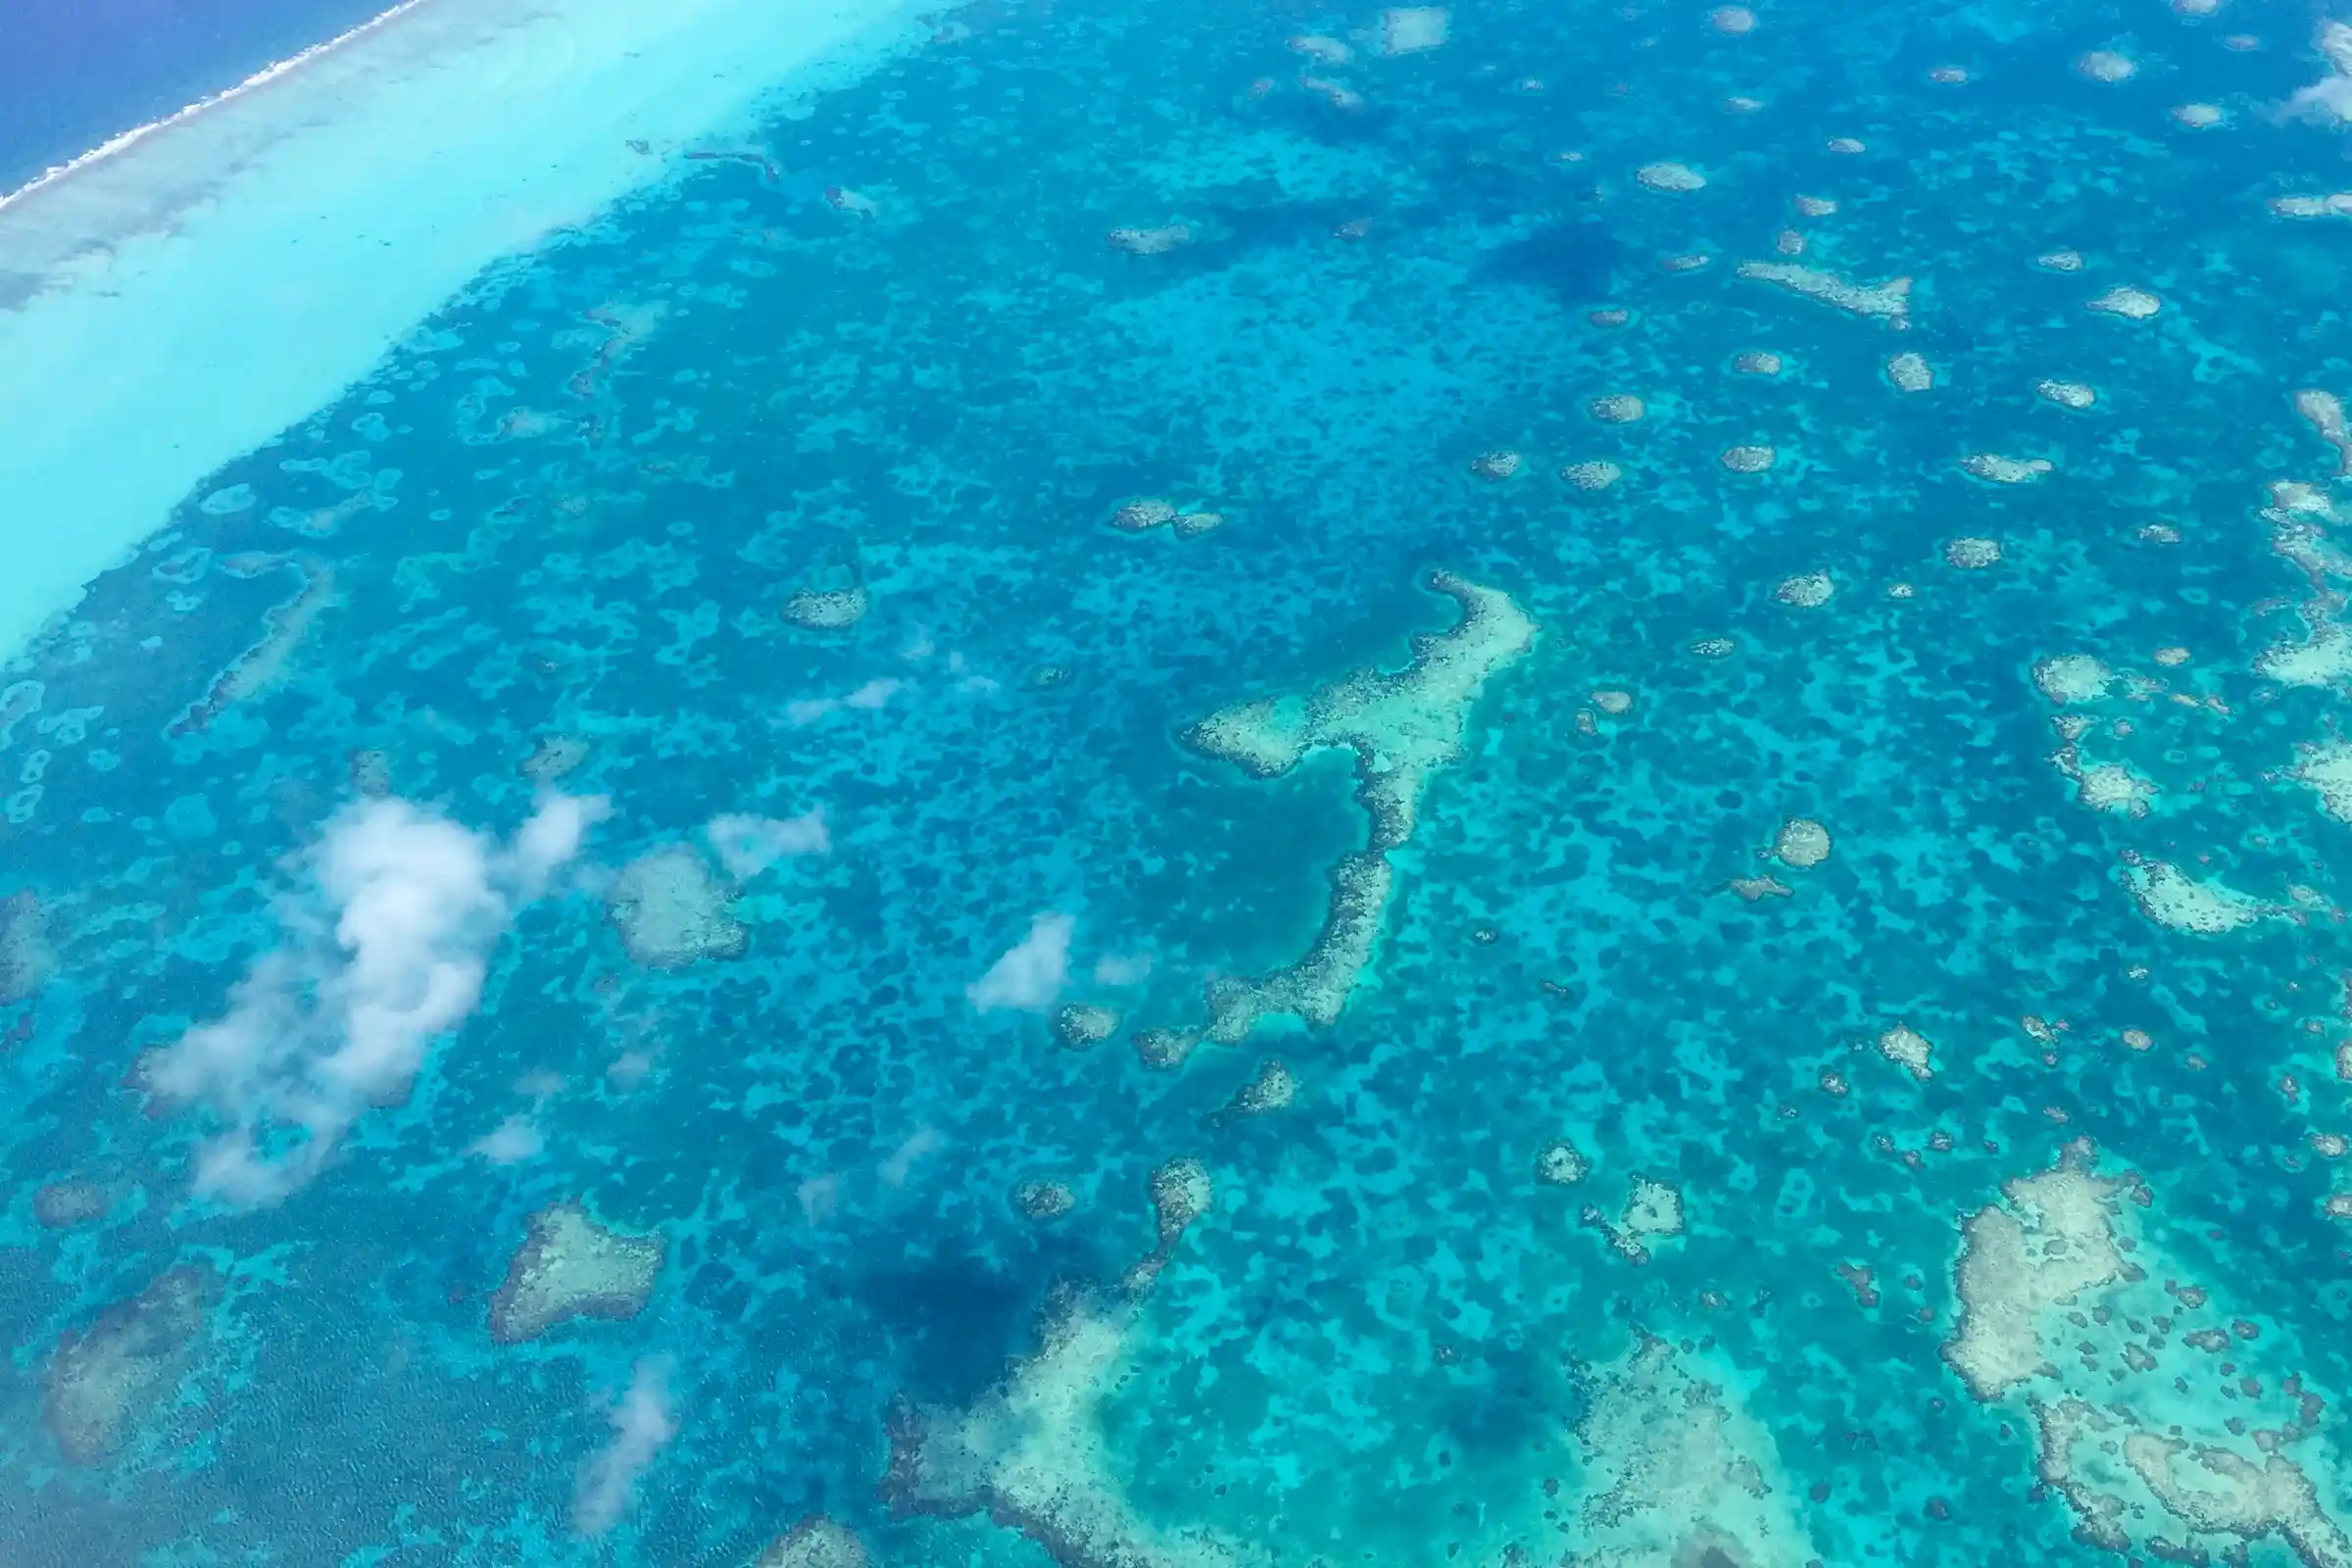
The team has a new idea to integrate an even more capable imaging spectrometer provided by the Jet Propulsion Laboratory (JPL) into a Twin Otter aircraft. Basing the operation in Kona, Hawaiʻi, the combined Carnegie-JPL team succeeds in generating the first fully integrated laser and visible-to-shortwave infrared spectrometer measurements from the air. The team flys from mountains to coral reefs, collecting a first-ever database for research and development that eventually leads to CAO-3.
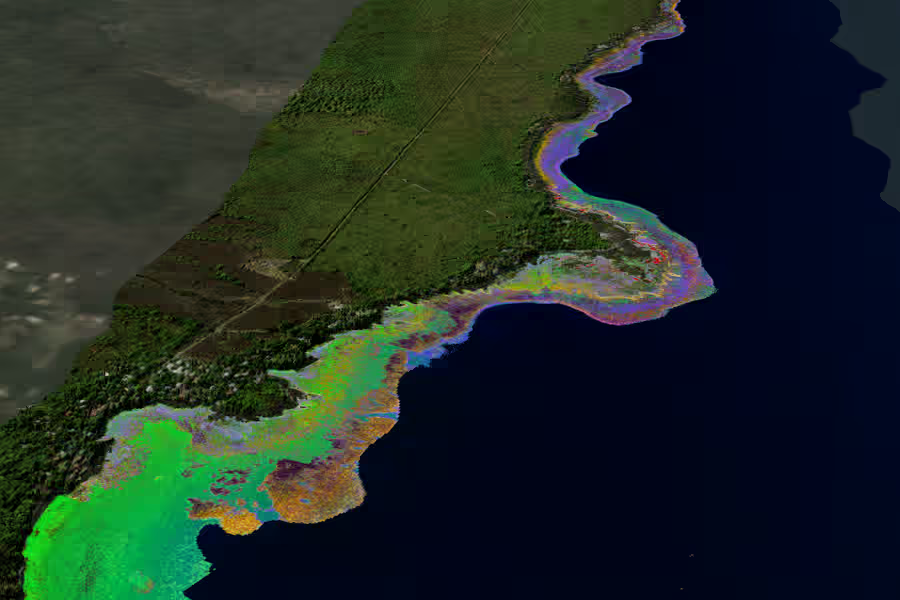
First Deployment from Hilo
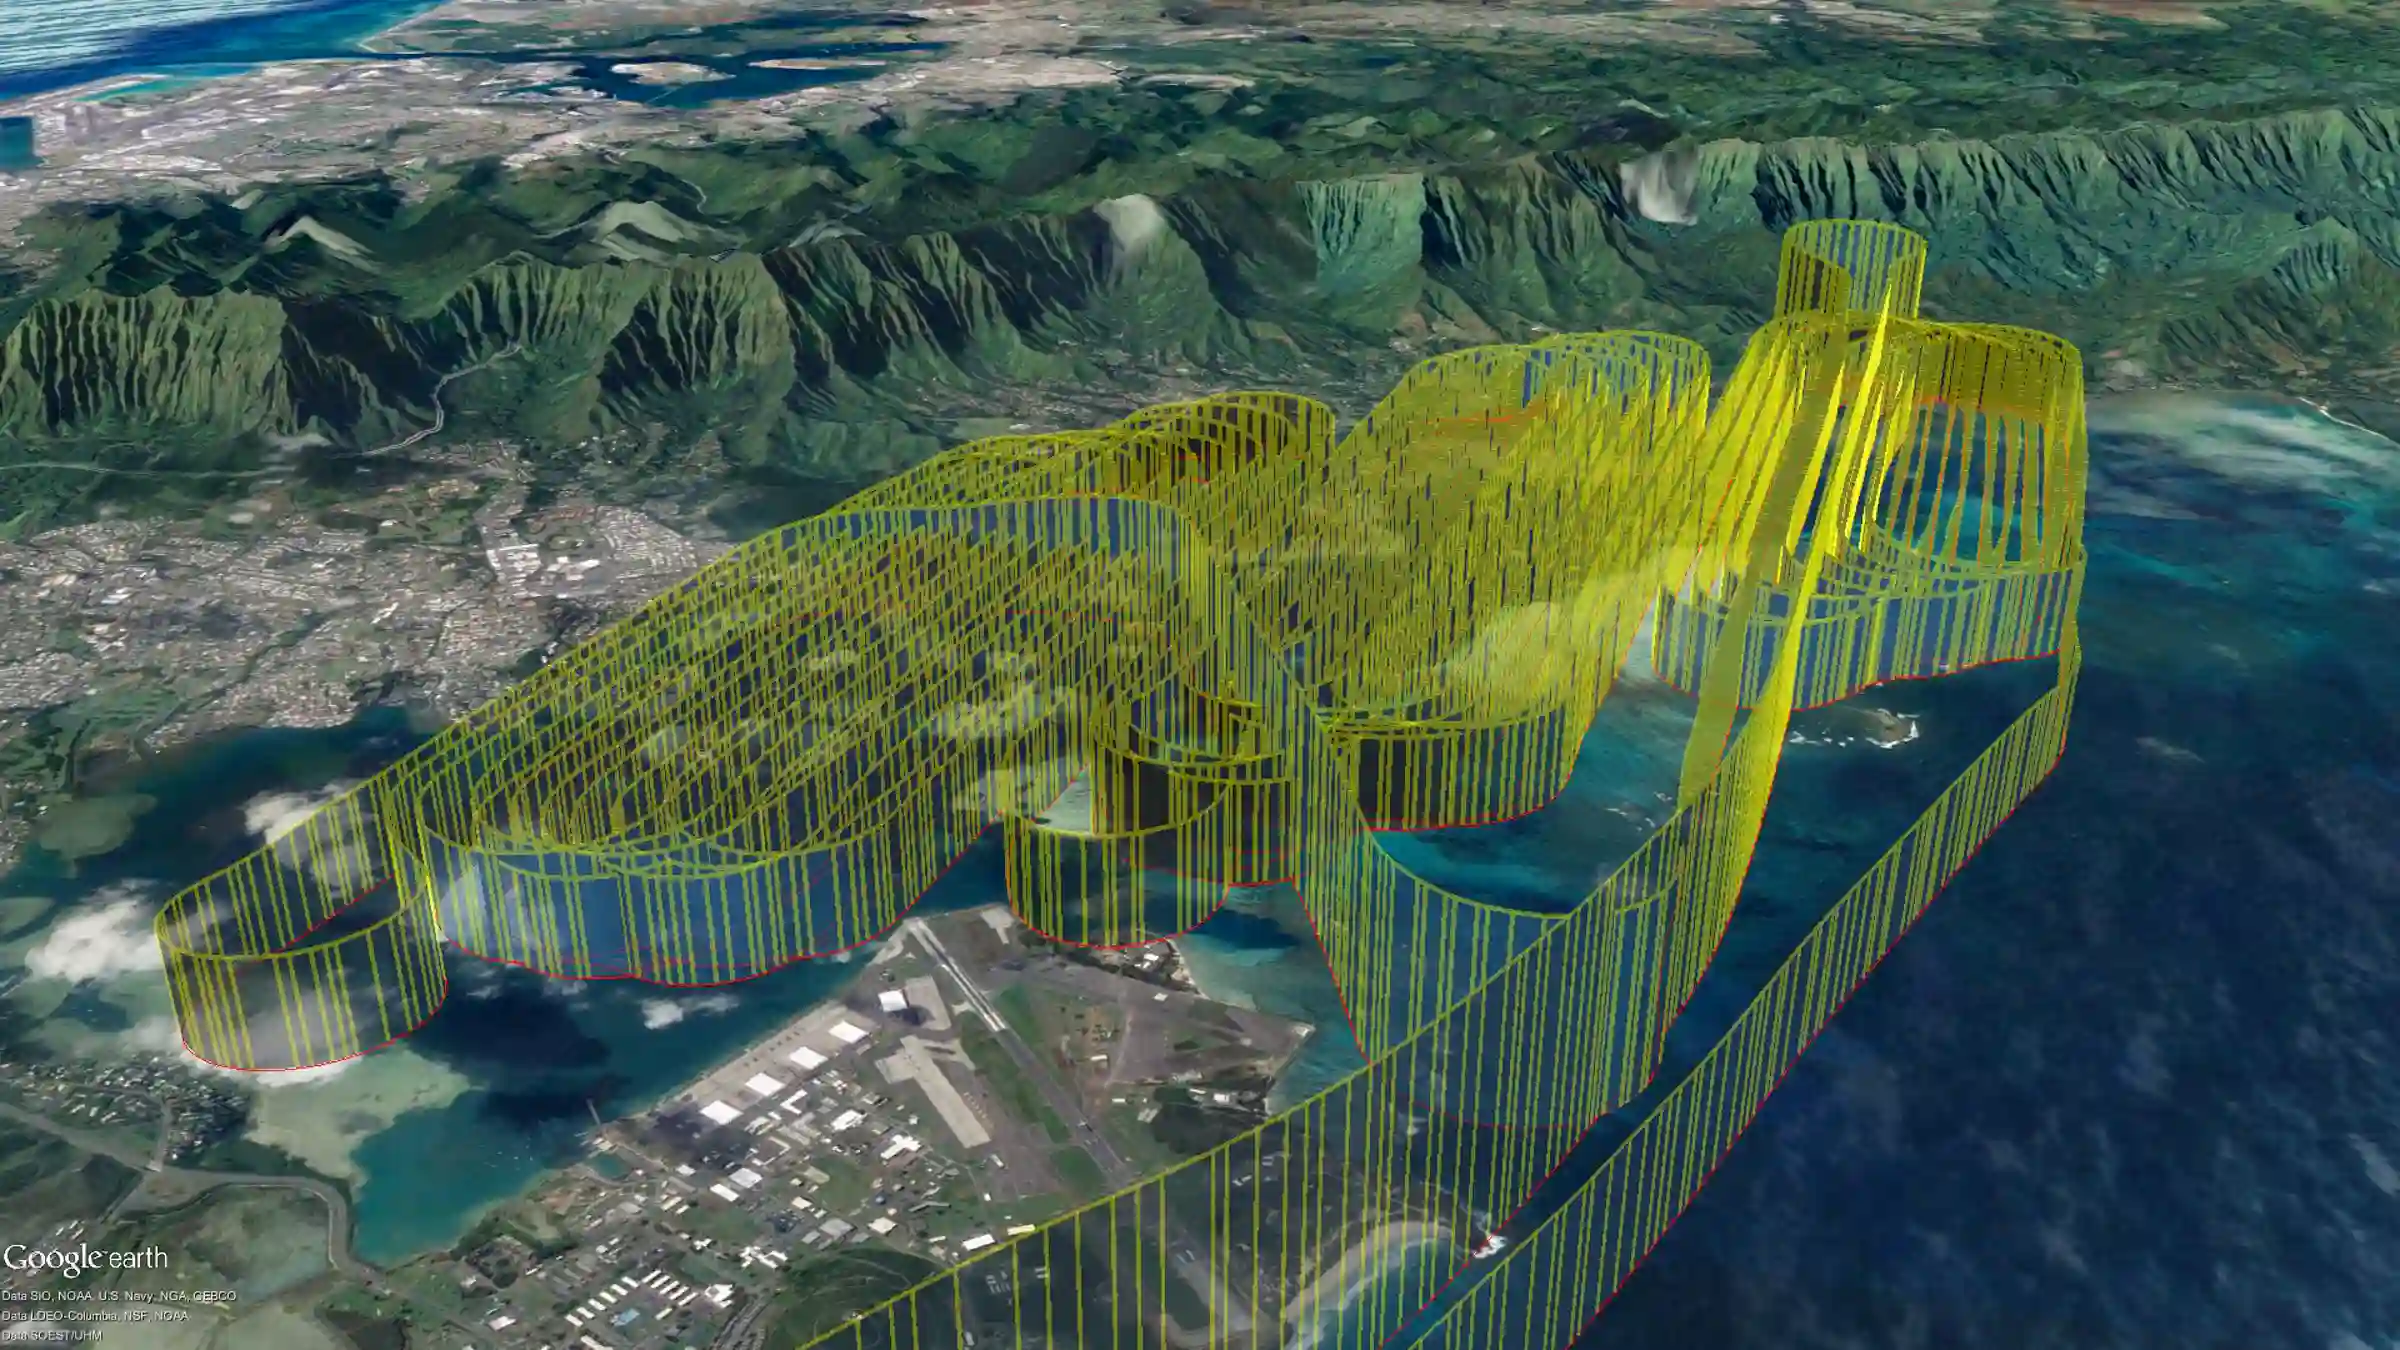
Until then, the team has been operating CAO-1/2 over Hawaiʻi Island, developing and improving the instrumentation, software, and data processing streams. The State of Hawaiʻi asks for the novel imaging on the island of Oʻahu, where forests remain only on remote mountain tops. The team uses this opportunity to spread its wings.

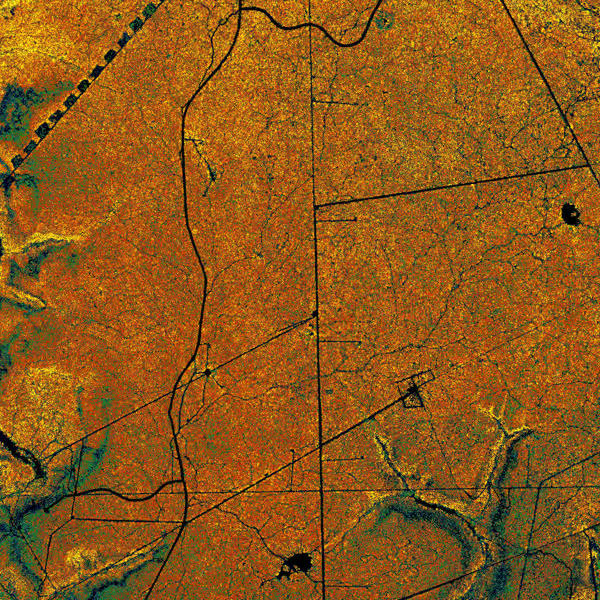
Kruger National Park
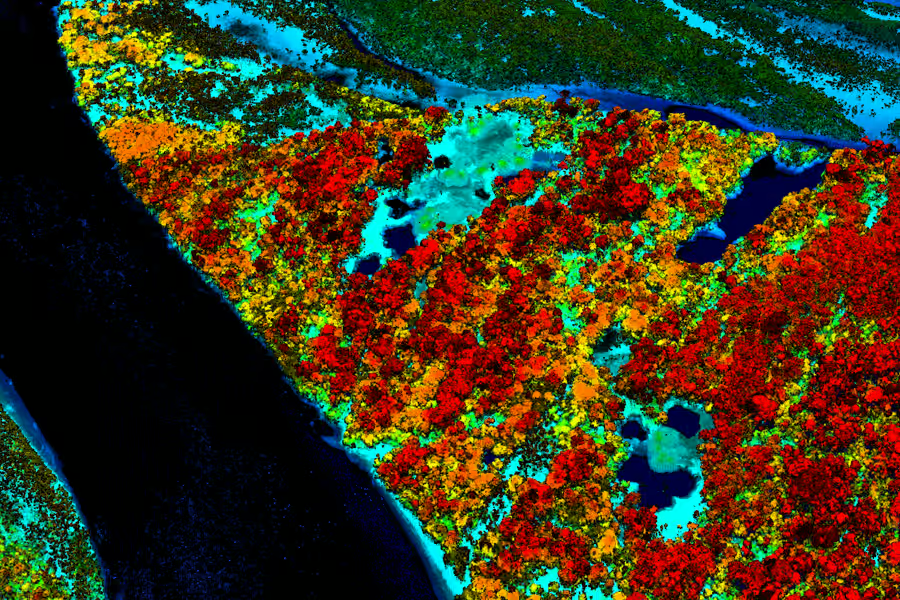
CAO takes flight over African savannas for the first time. In partnership with South African National Parks, the team surveys Kruger's 1.9 million hectares — mapping over 10 million trees to understand how the park's booming elephant population is reshaping the landscape.
Other Side of the World
The story of CAO makes the news, and Bill Robertson from the Andrew Mellon Foundation comes to Hawaiʻi to ask Greg if they can map the savannas of South Africa. Just 12 times zones away, and on the exact other side of the planet, the challenge is too exciting to turn down. The CAO team and equipment travels to Kruger National Park and makes maps of savannas 3D structure and chemistry to assist conservation managers. The entire adventure opens the world up to their airborne program.
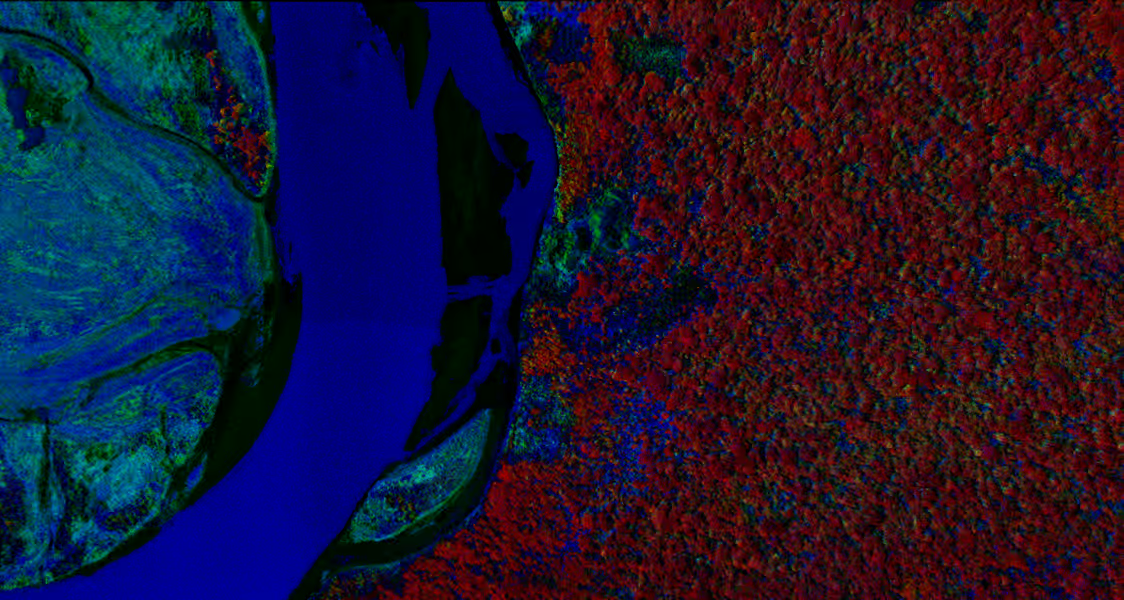
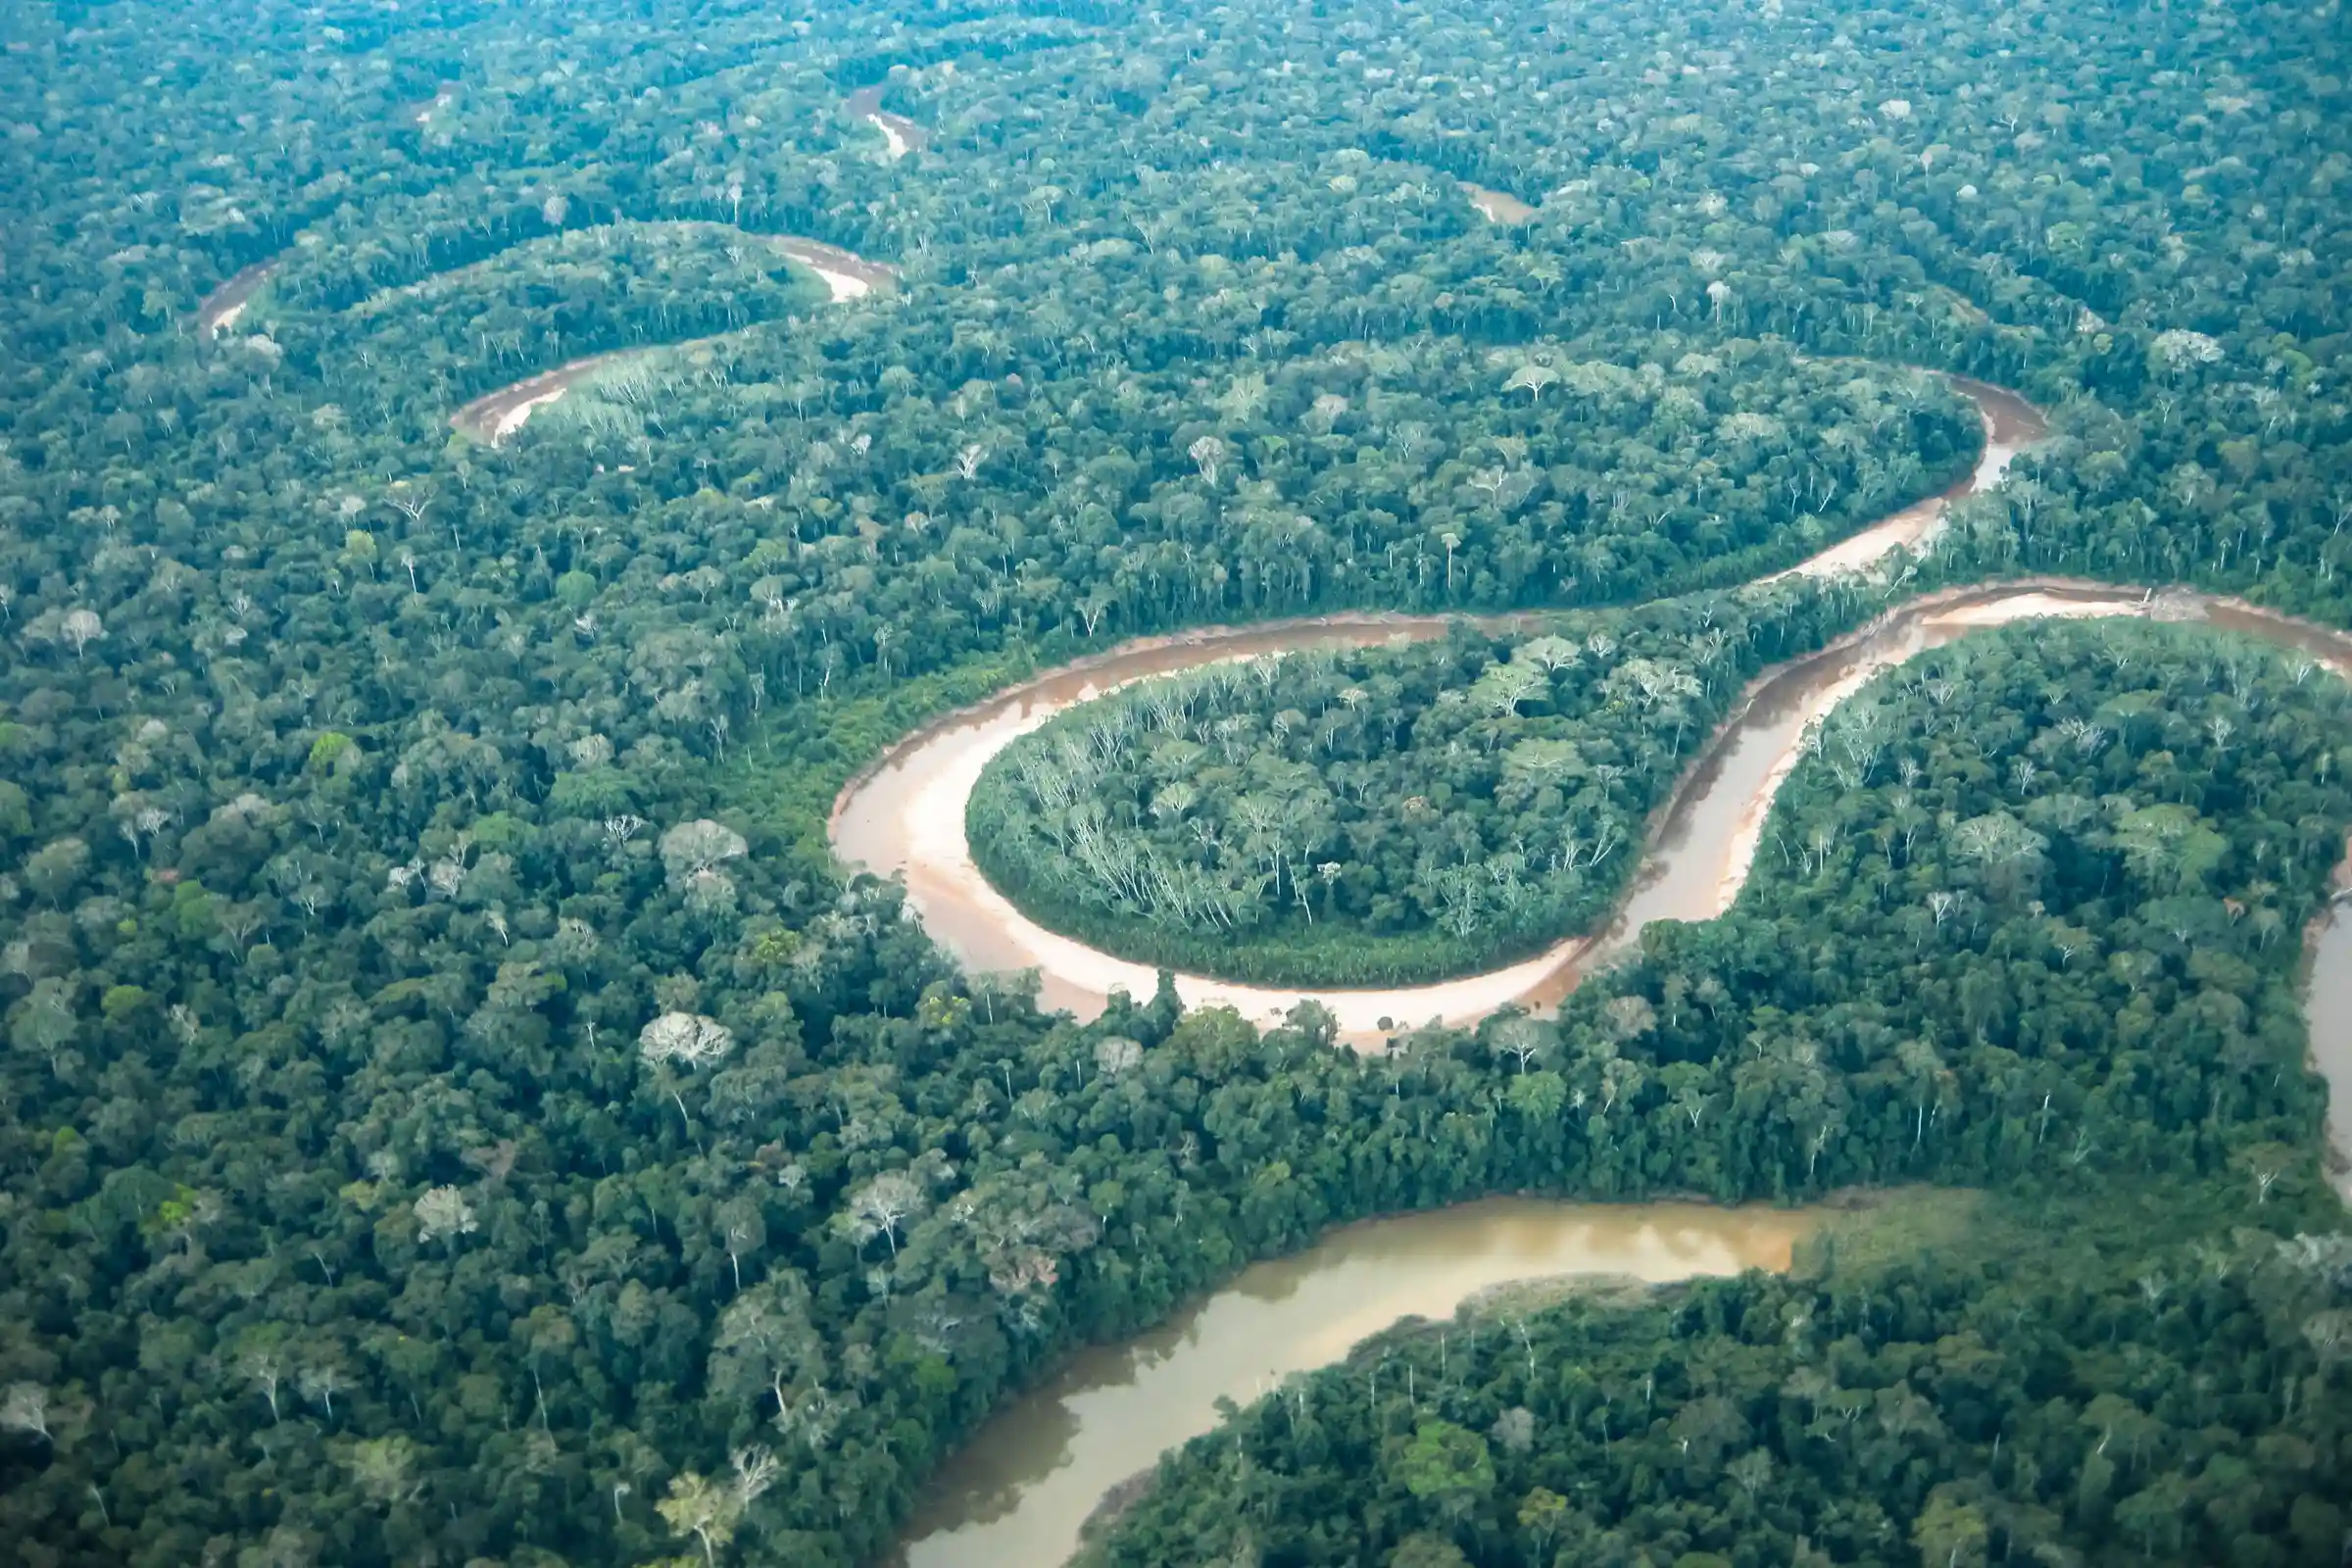
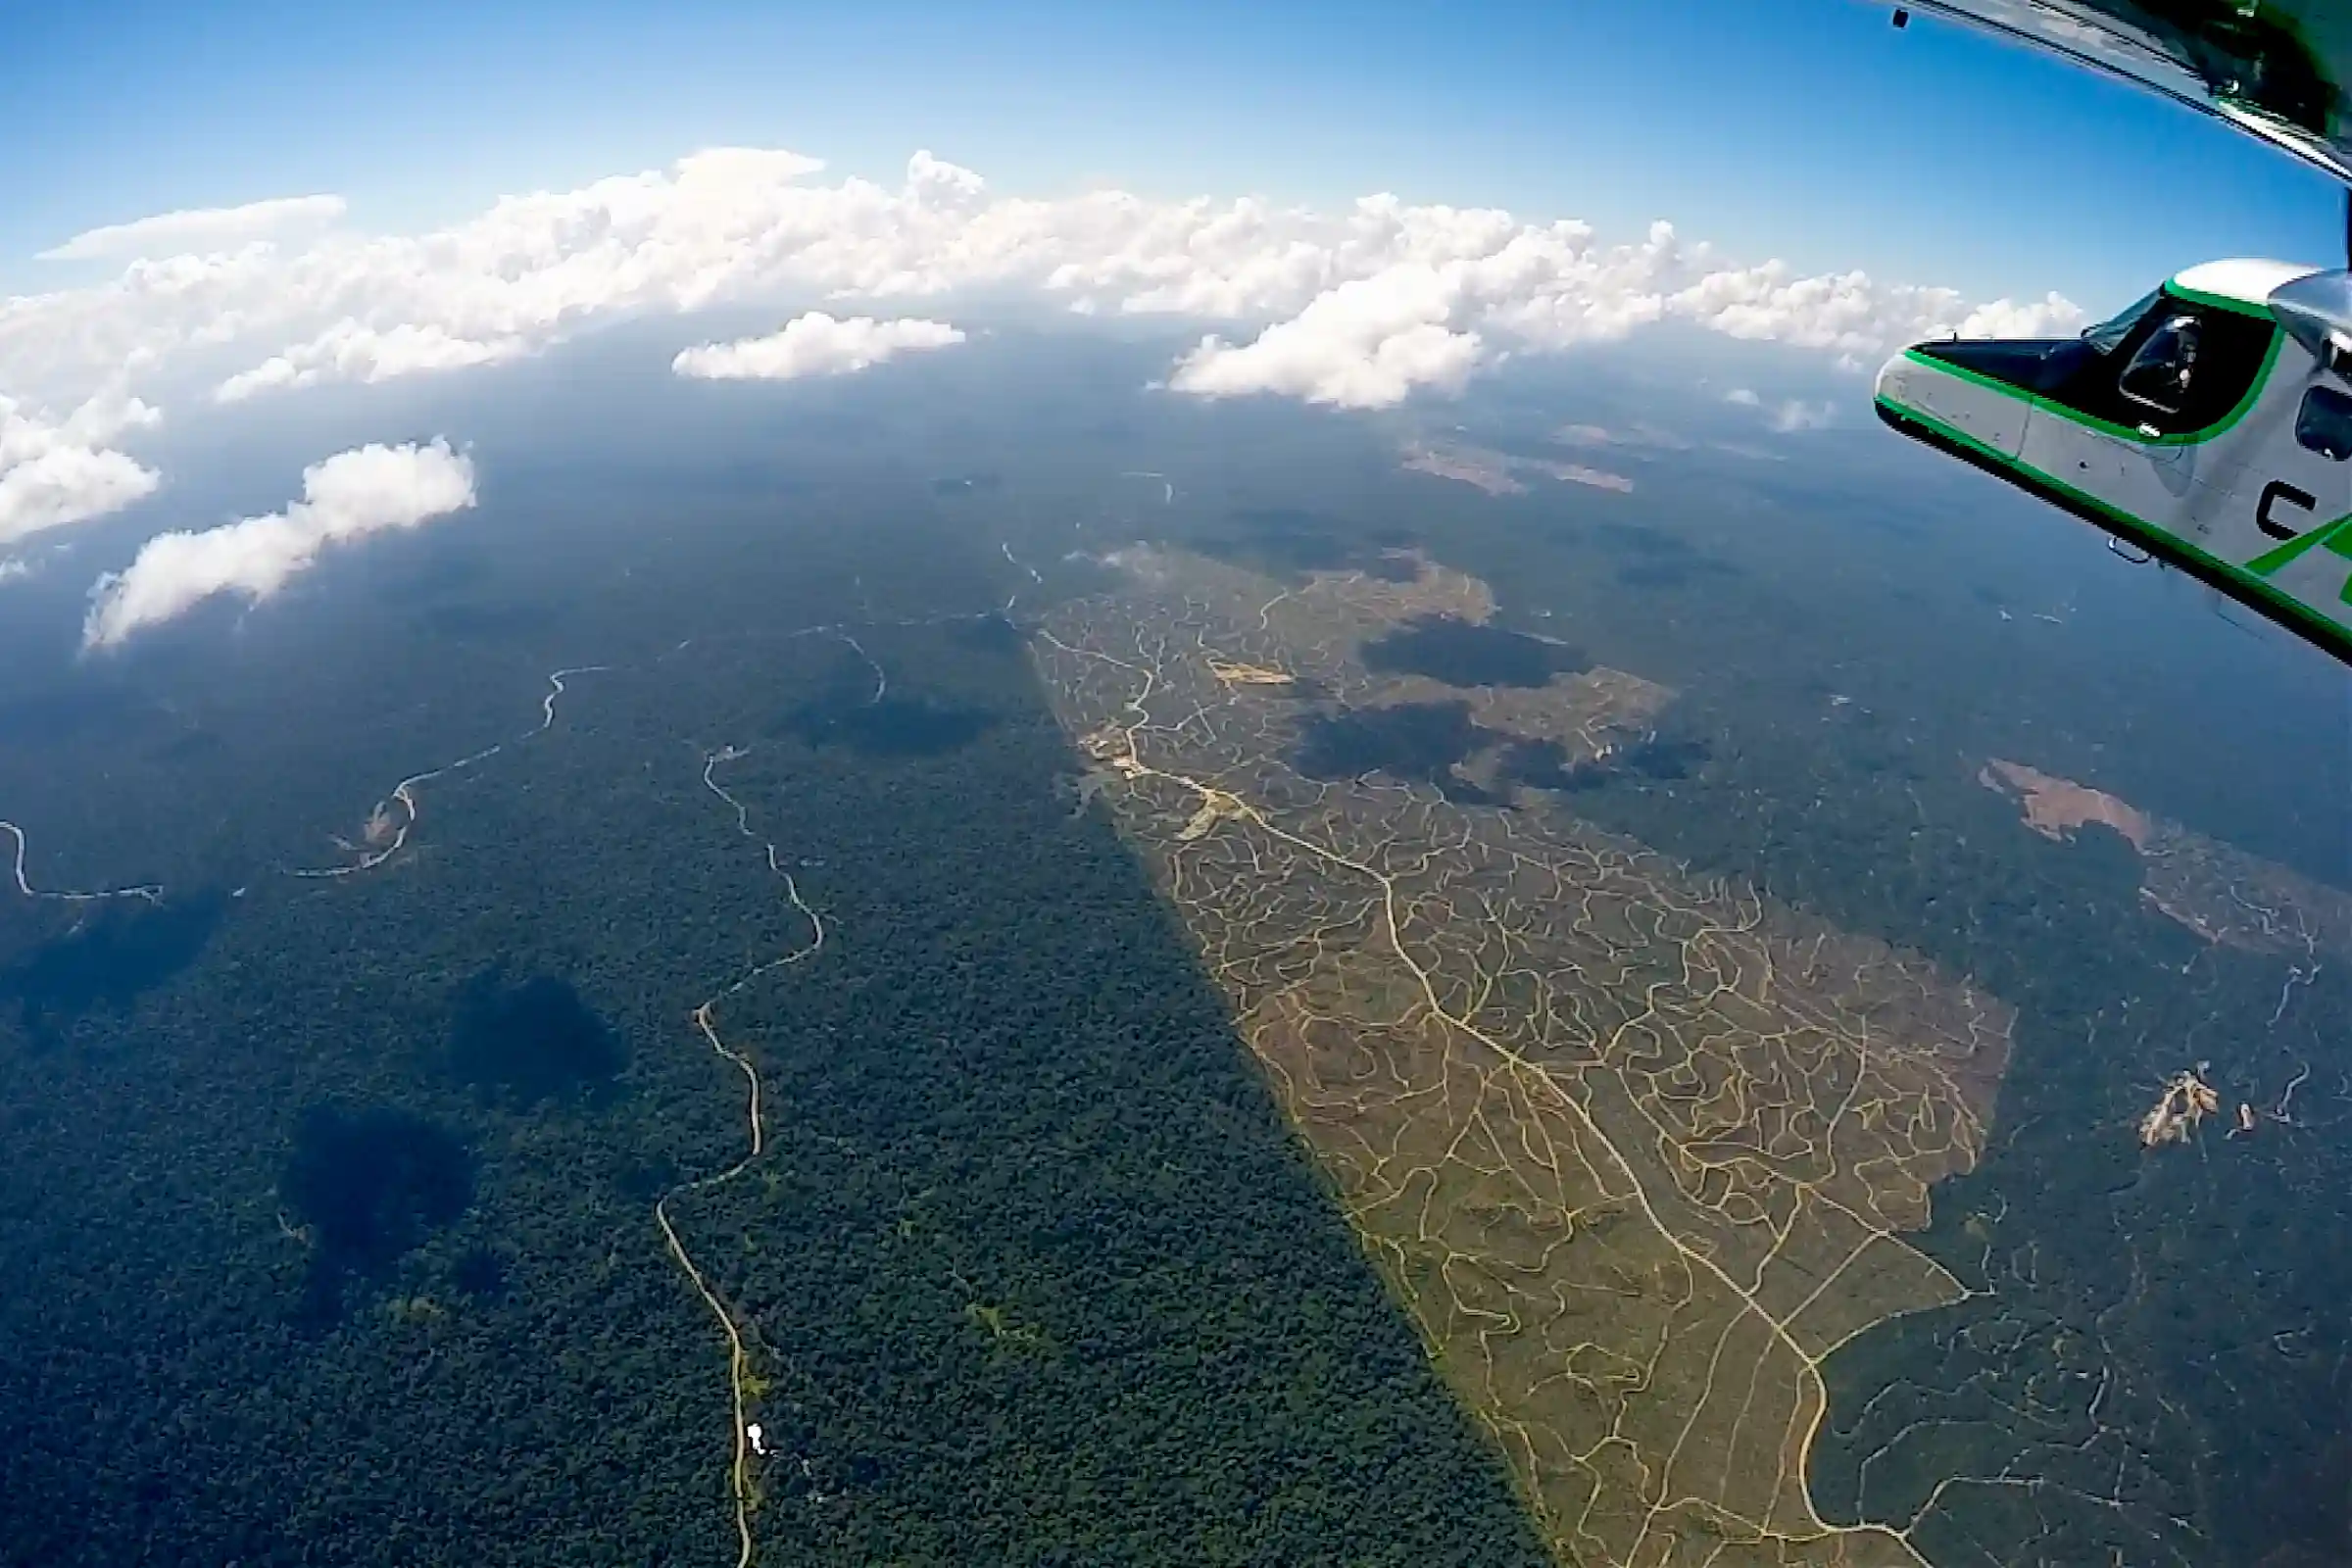
Opening Amazonia
In preparation for future biodiversity mapping flights in the Amazon Basin, the Spectranomics team heads to the Peruvian lowlands to collect the world's first Amazon canopy library of species and their spectral-chemical properties. This sets in motion a worldwide tour of tropical canopies that will ultimately become the Spectranomics Database.
Completing the Family Tree in Australia
Two years of fieldwork culminate in the most comprehensive spectral library of tropical tree species ever assembled. Hundreds of species cataloged — their chemical fingerprints now readable from above. The ground truth is complete. Spectronomics can fly.
CAO Supports Hawaii Decision-makers
State of Hawaiʻi decision-makers ask CAO to collect a wide range of data addressing biodiversity, invasive species, and forest carbon questions. This opens doors for more airborne science in support of government actions to protect the environment across the State of Hawaiʻi.
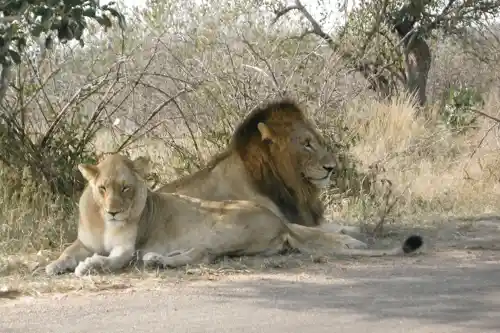
Assessing the Effects of ʻThe Big Fiveʻ
CAO returns to South Africa in a massive campaign to map the 3D structure of Kruger National Park. They discover the interactions and behavior of The Big Five - lions, elephants, rhinos, leopards, and buffalo. All-new lion behavioral discoveries are made, setting the stage for Gregʻs Global TED Talk in 2012.
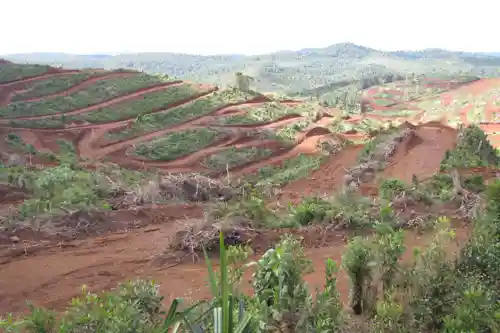
A Race for Rare Species in Madagascar
The Spectranomics team heads to the lowlands and montane tropical rainforests of Madagascar. While climbing and collecting foliage from hundreds of tree species, they run into a mining company systematically removing the forest. The team races to collect and catalog species doomed in the path of massive bulldozers.
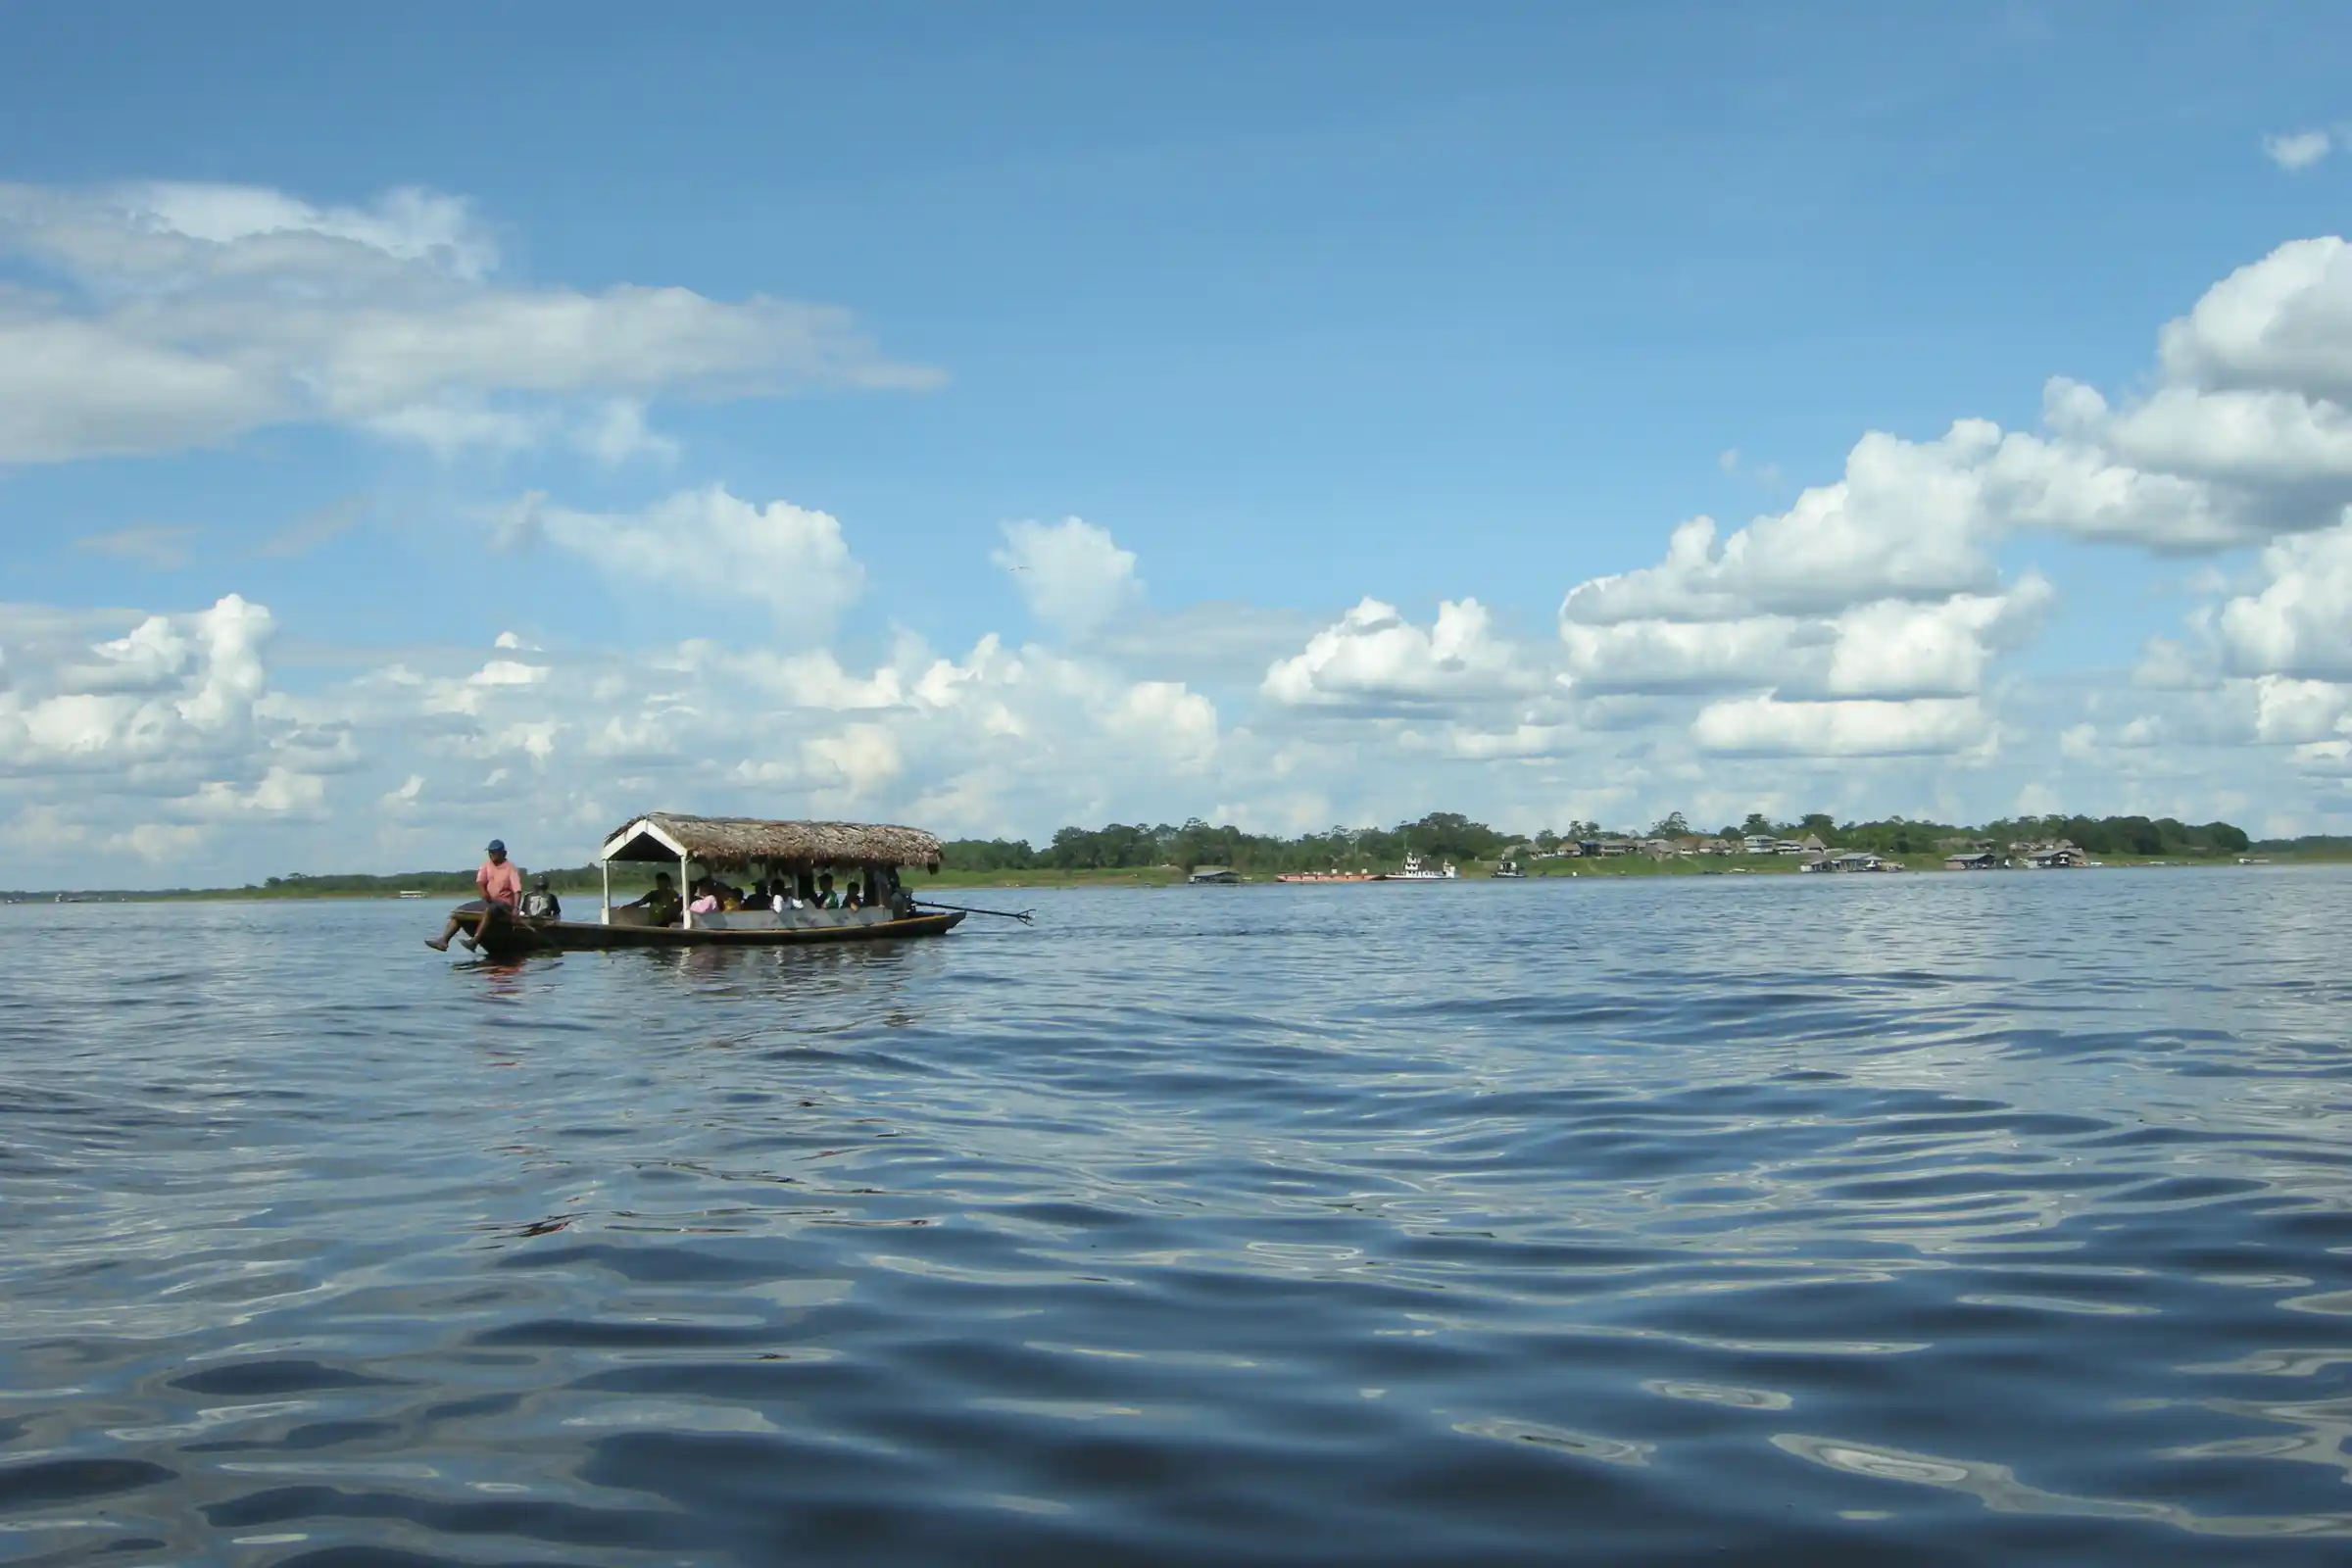
Search for Western Amazon Species
The Spectranomics team treks into the Peruvian uplands where the Amazon meets the base of the Andes in search of more canopy tree species for the Database. They utilize old trucks, canoes, and long hikes and tree climbs to collect more than 800 new species.
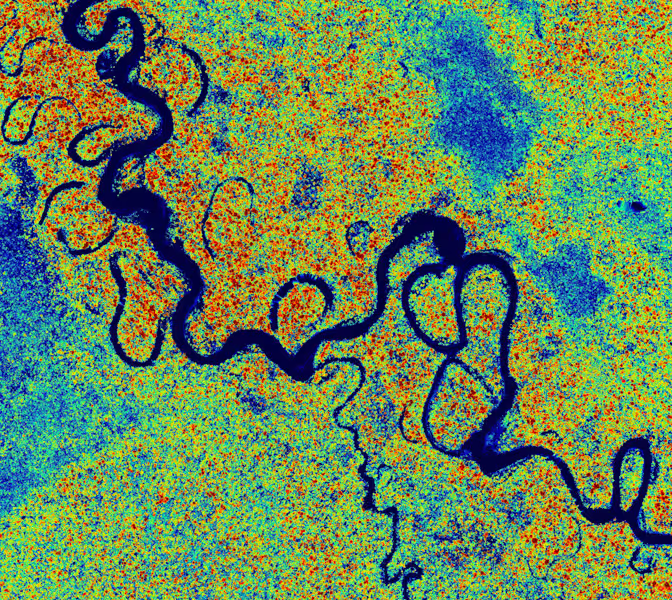
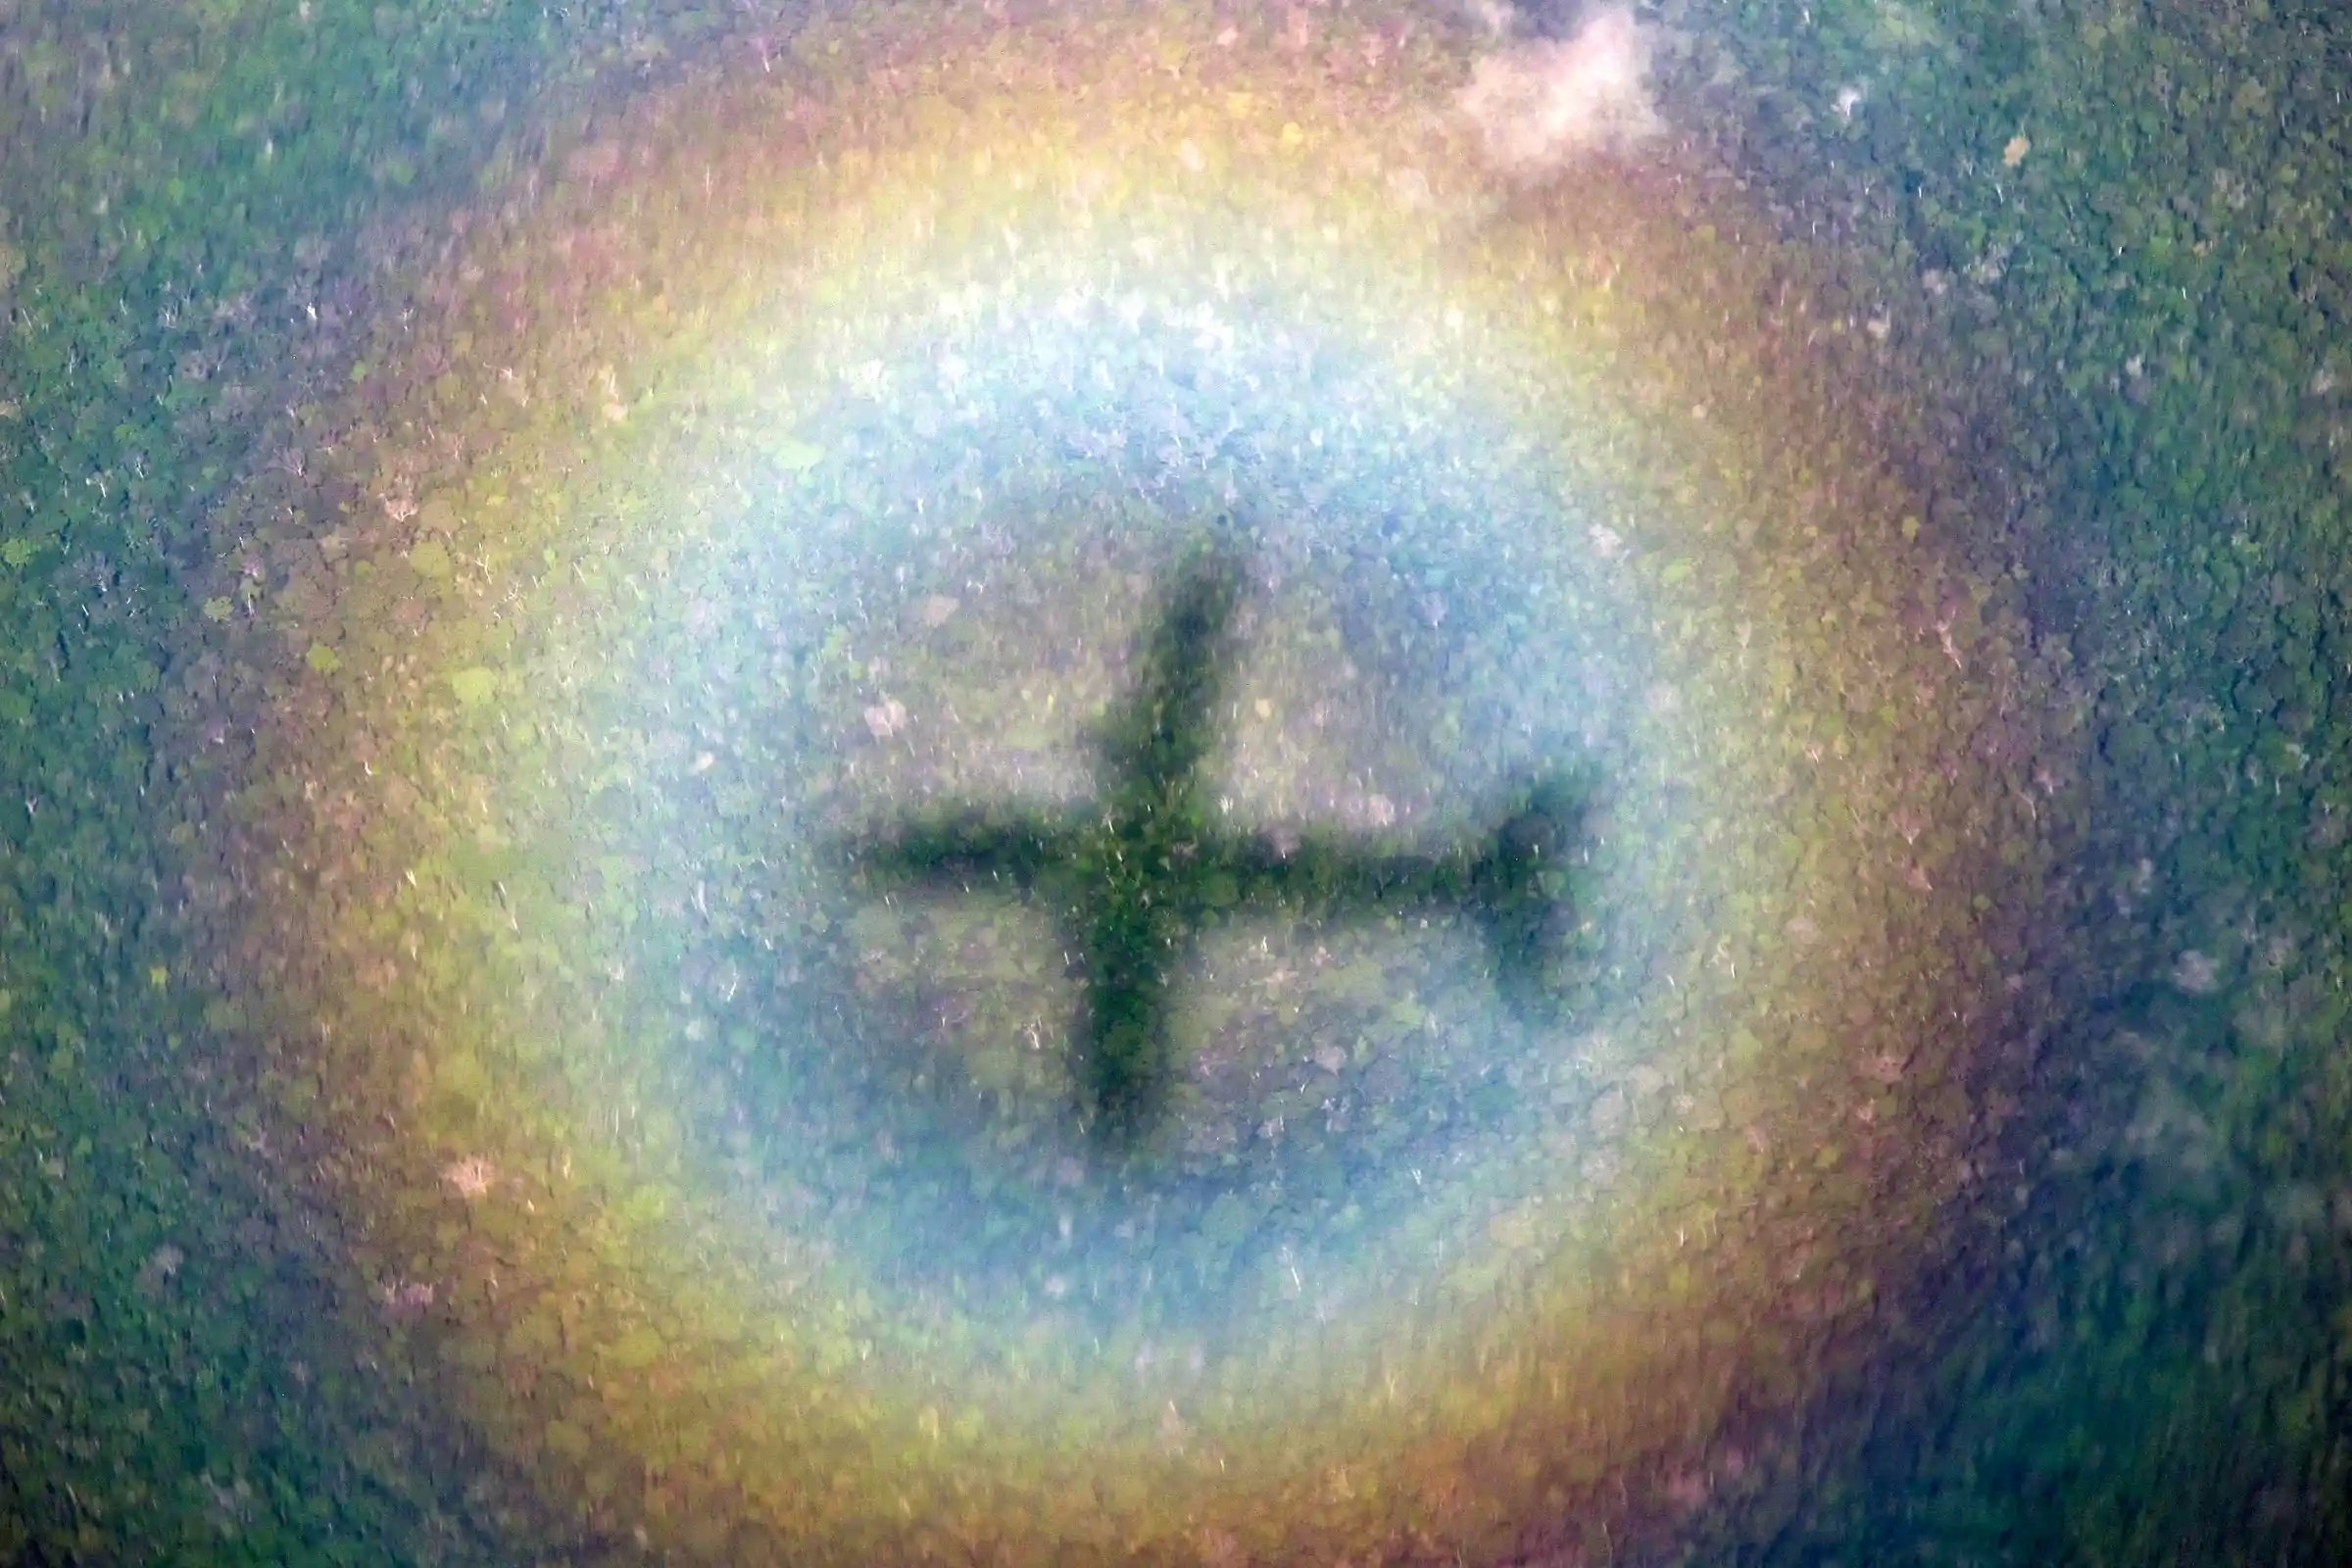
Colombia — Night Flights Over FARC Territory
CAO flies over FARC-controlled Colombian Amazon with all lights out to avoid ground fire. Military briefings, night-flying, ordnance visible below. President Santos flies aboard with fighter jet escort and Black Hawk helicopter.
Return to Colombia, and Disaster
In a second visit to the Colombian Amazon, the team again maps only at night using infrared lasers. Partway through the mission, the suffer a failure of an aircraft engine following a lightning strike. The team is grounded on a Colombian air force base for a month where they replace the engine in the field, complete the mission, and head home.
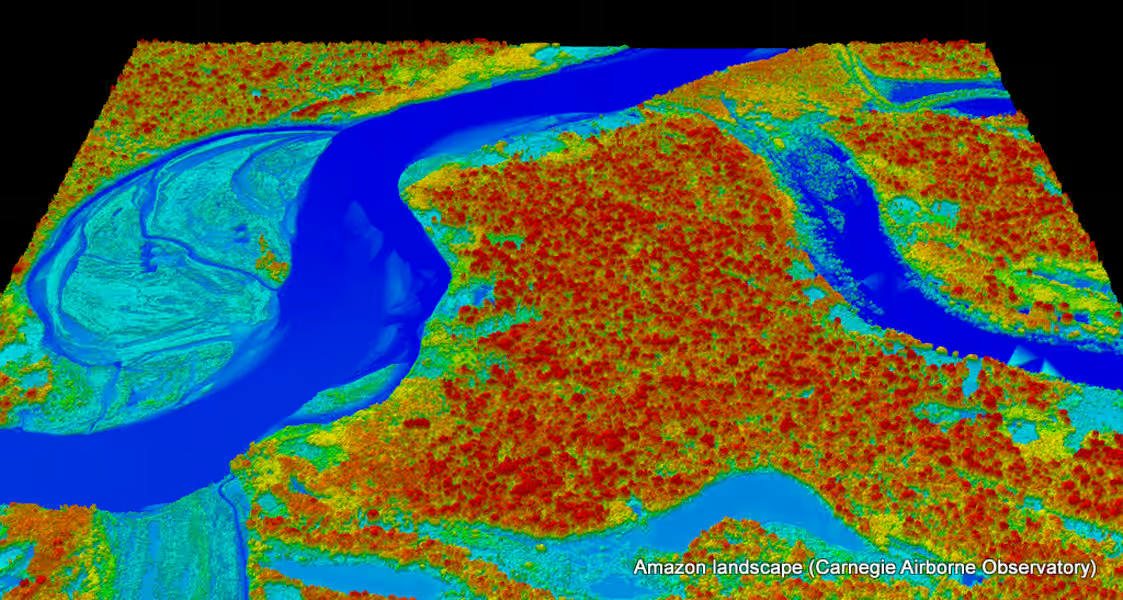
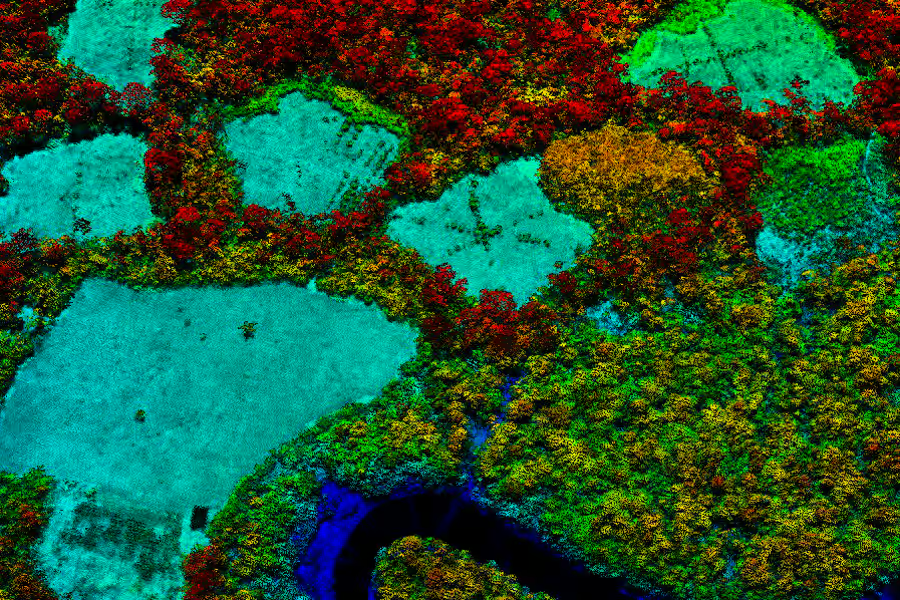
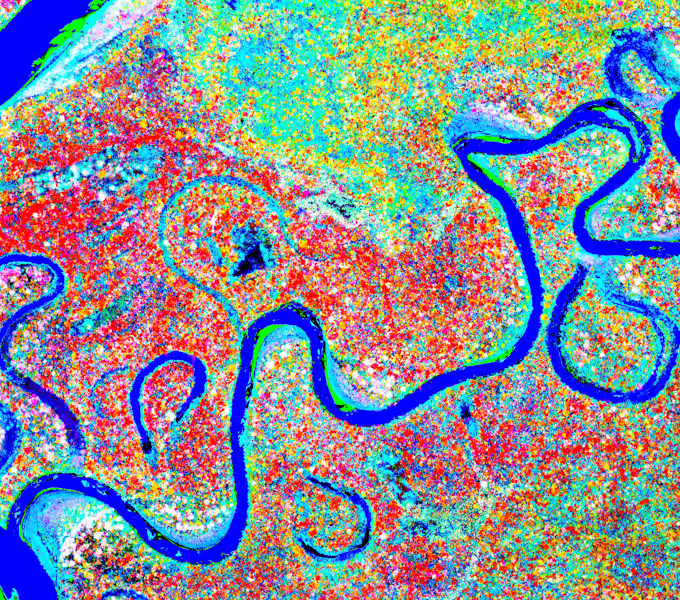
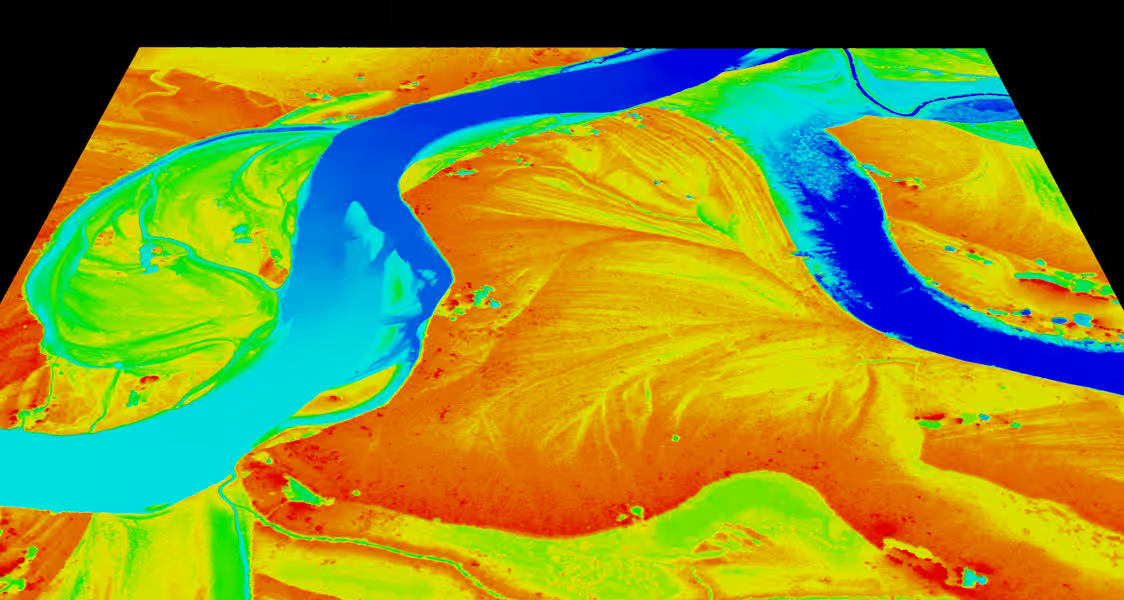
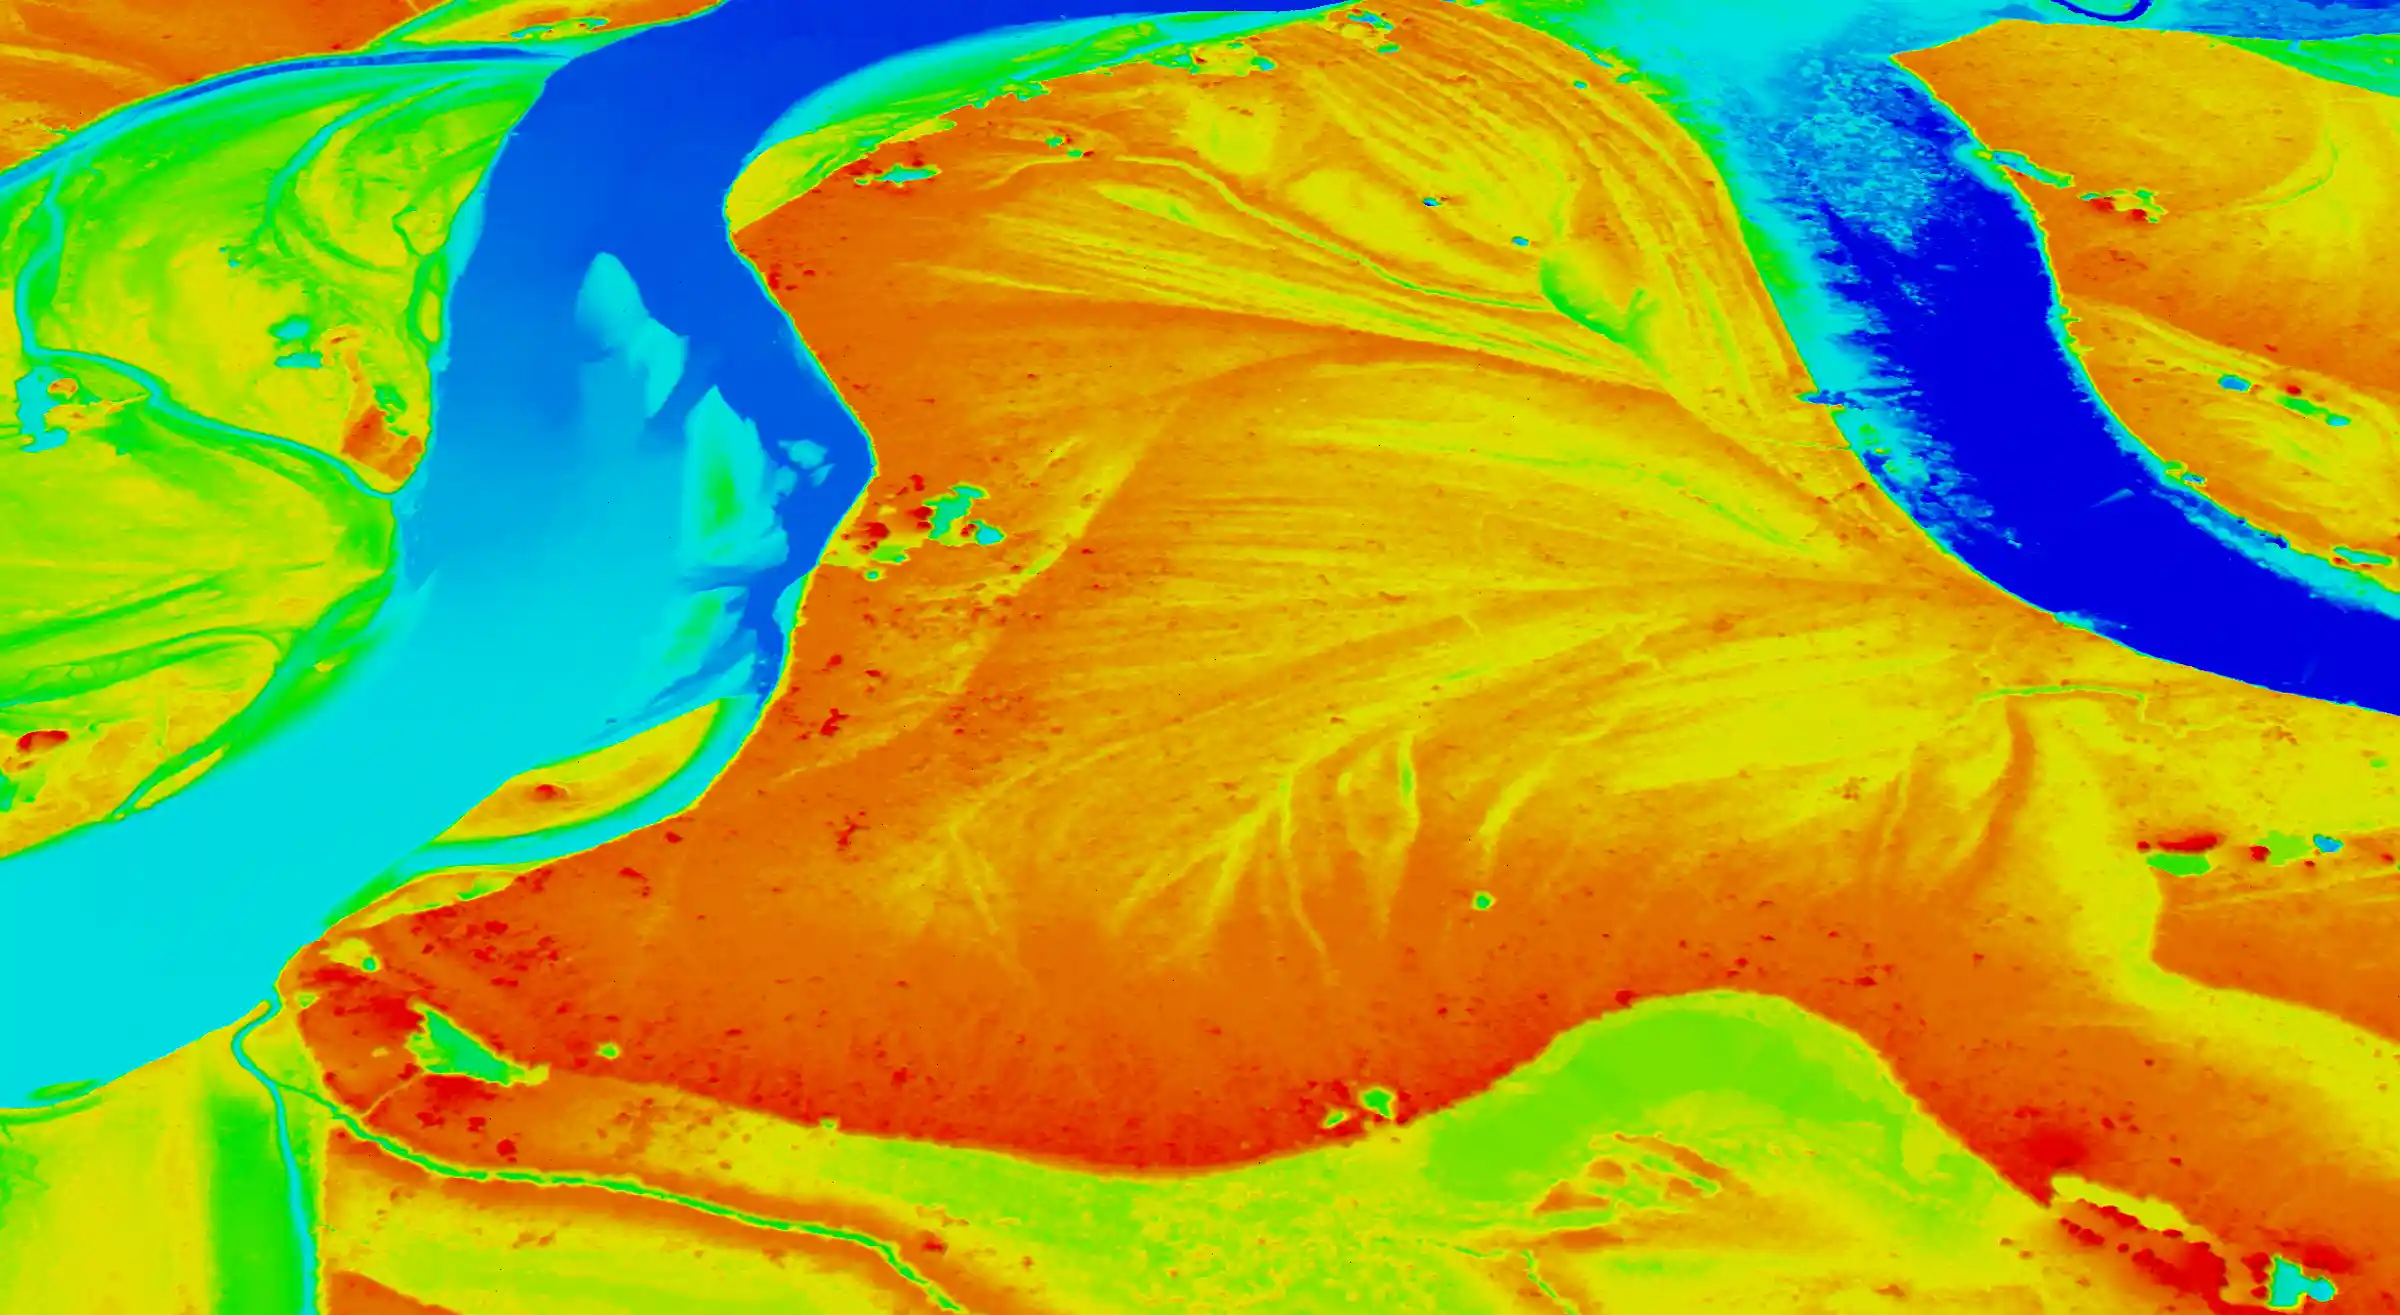
Amazon Mapping, the Final Frontier
Returning to Peru for the frouth time since 2009, the team maps the entire northern region including ultra remote areas bordering Ecuador, Colombia, and Brazil. They ultimately discover an entirely new type of forest biodiversity that later becomes a new national park.
All Lasers on Elephants
The team maps Addo Elephant National Park in support of research and management focused on the carrying capacity of the part to house massive herds of elephants. They discover limits to the number of elephants that the park can protect before the habitat is trampled to death.
Lions, Lions, Lions
The team combines its mapping capability with a new approach to GPS tracking of male and female lions across a regional park in eastern South Africa. They discover how lions interact wth other predators such as wild dogs and hyenas, in shaping the savanna-woodland landscape.
Extreme Amazonia
Greg and two other Spectranomics leads, Raul Tupayachi and Felipe Sinca, journey to the most remote rainforest in all of Amazonia. At the virtually untouched border between Peru and Ecuador, the three collect more than 100 new tree species, analyzing spectral, chemical and phylogenetic properties.
Borneo — World's Tallest Tropical Tree
CAO laser-scans Sabah's forests and discovers 50 trees breaking the world record for tallest tropical tree. The champion: 94.1 meters in Danum Valley. Crown diameter of 40 meters — half a football field. Helicopter verification funded by James Cameron.
Allen Coral Atlas Begins
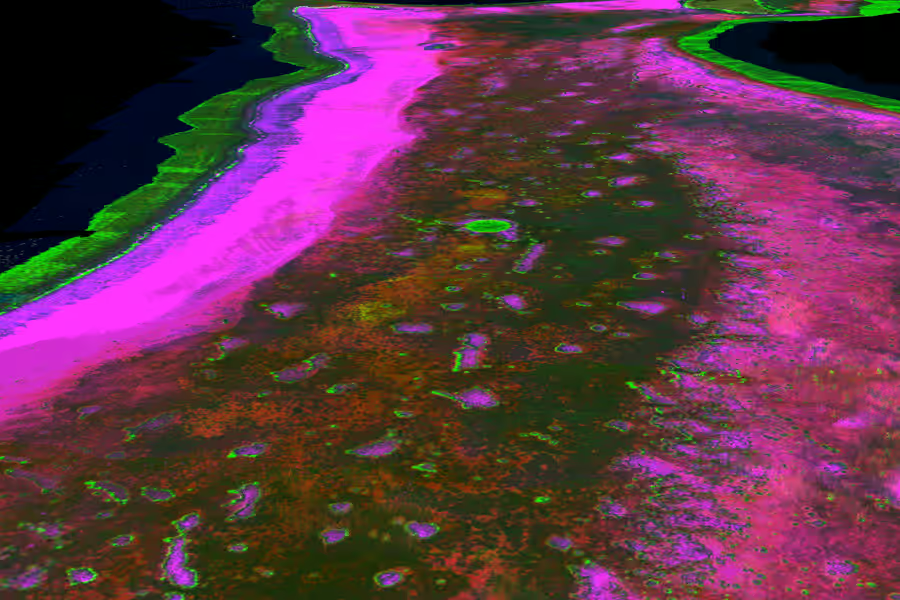
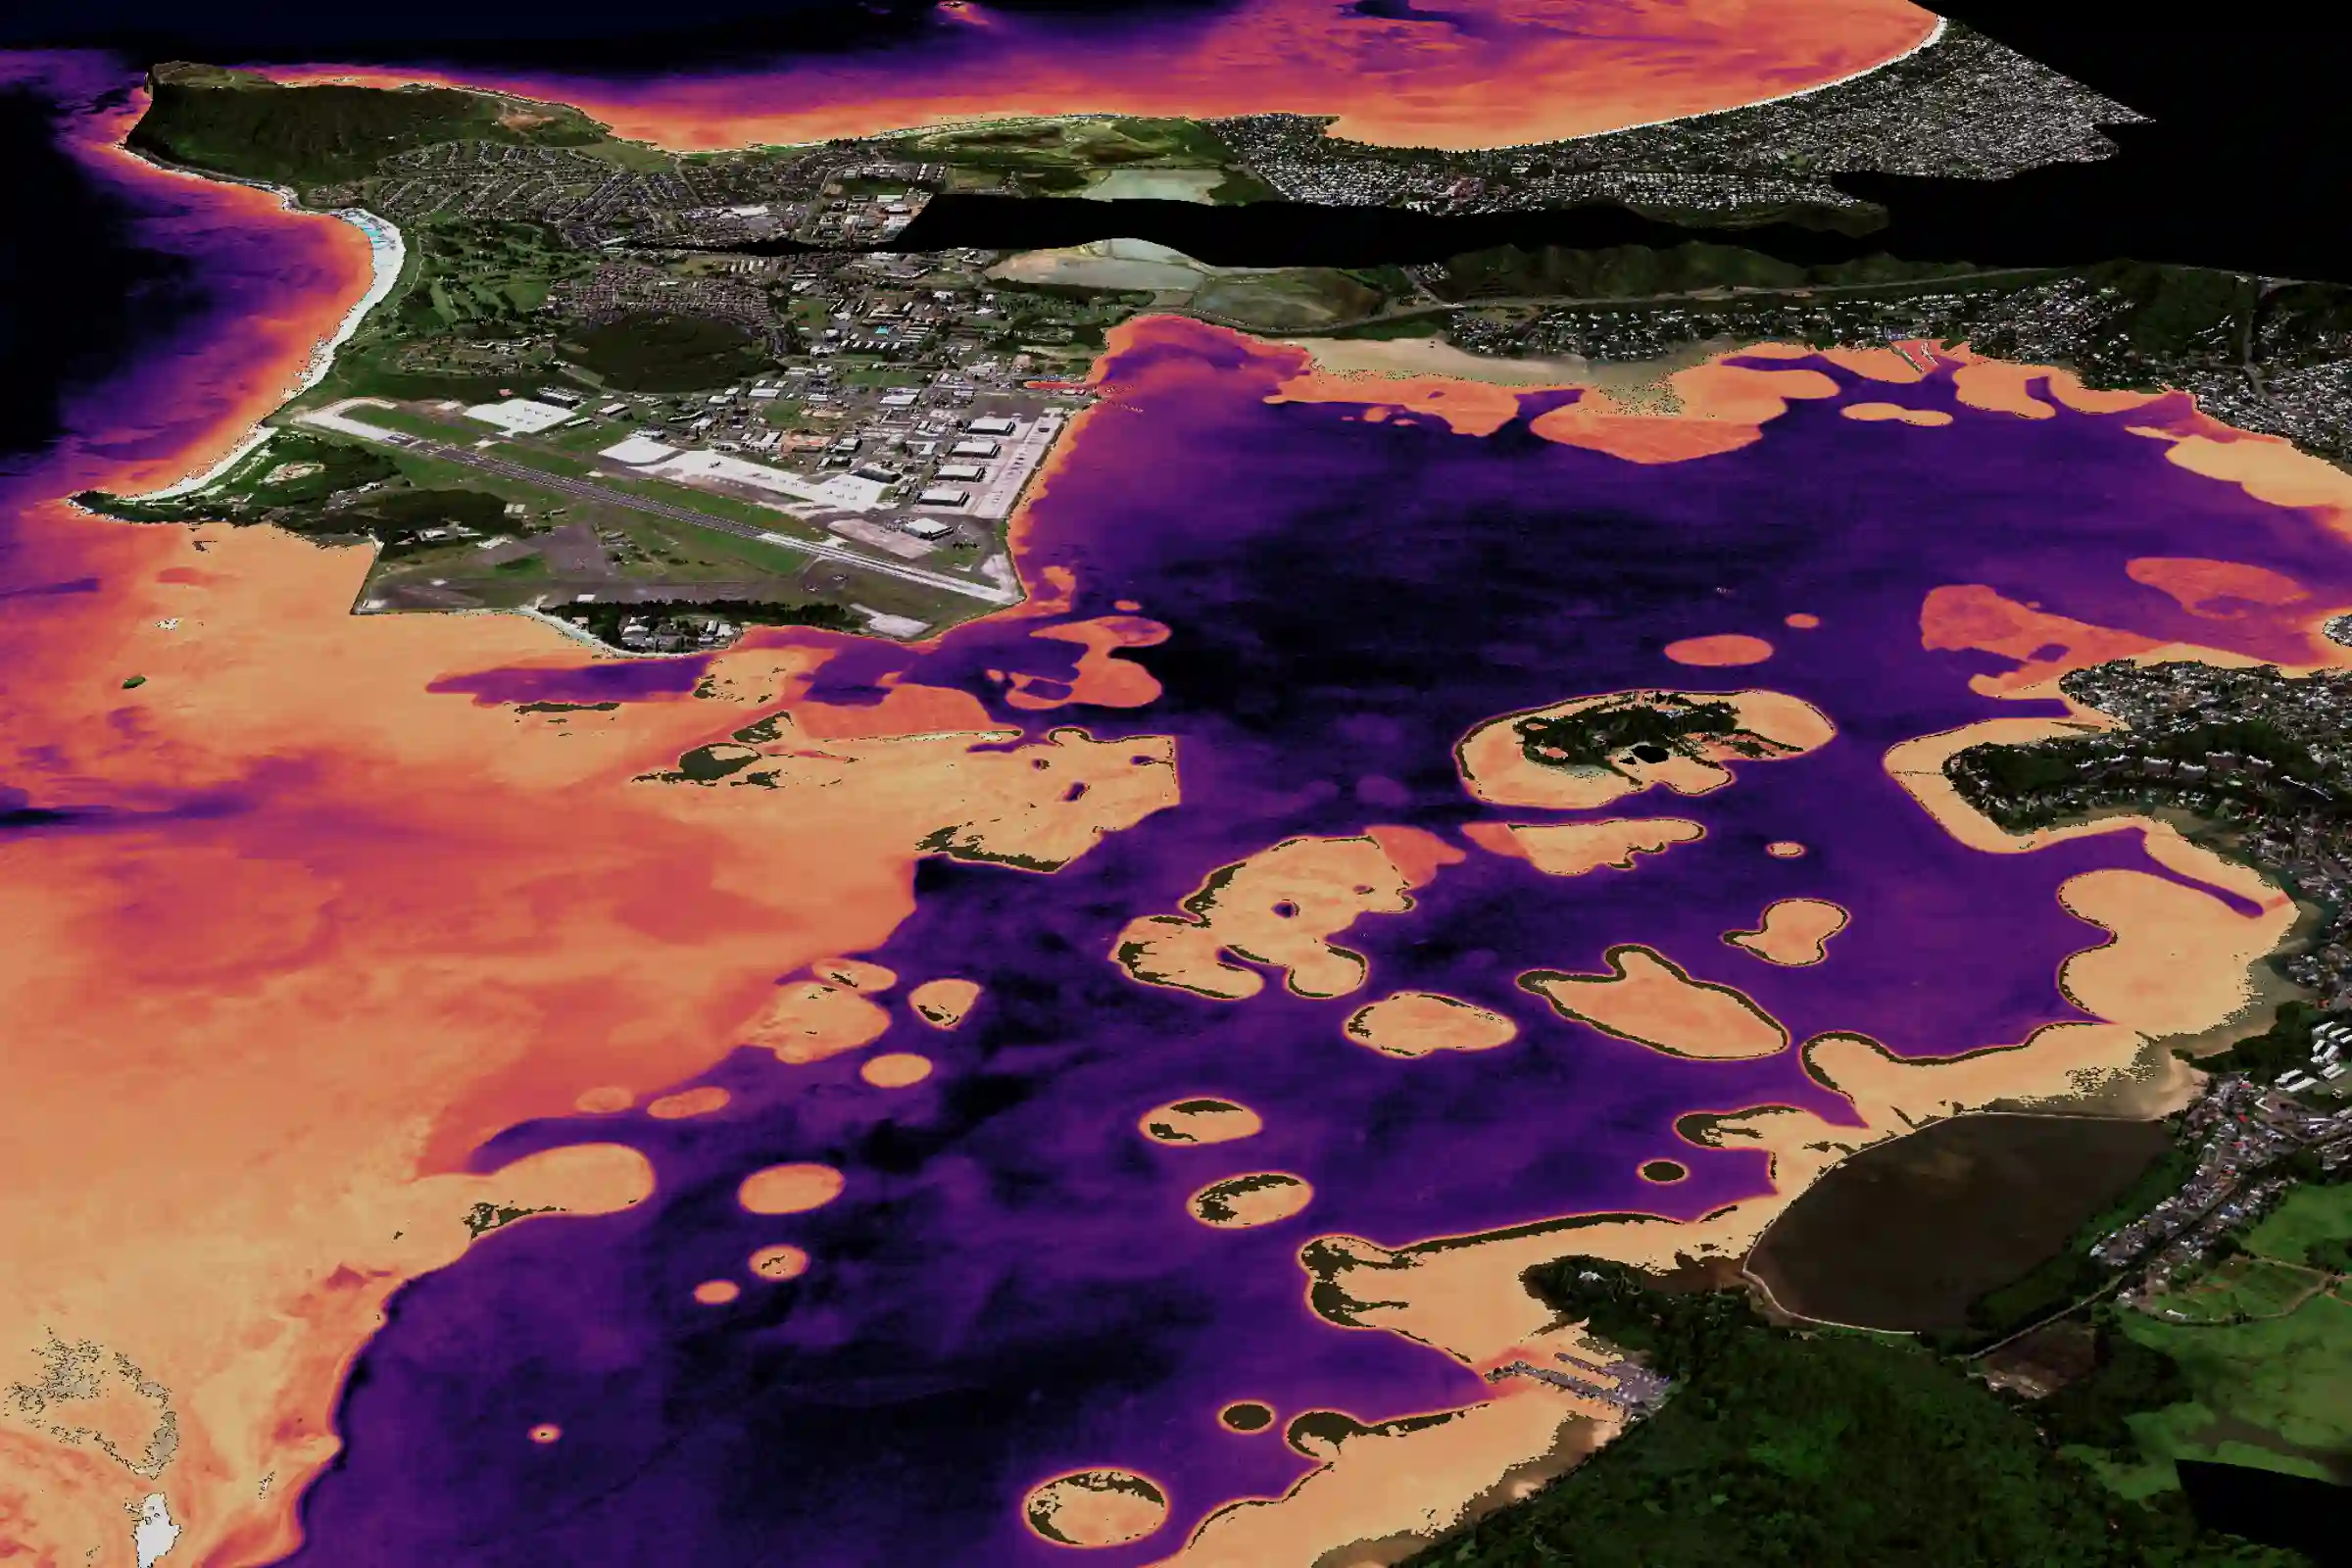
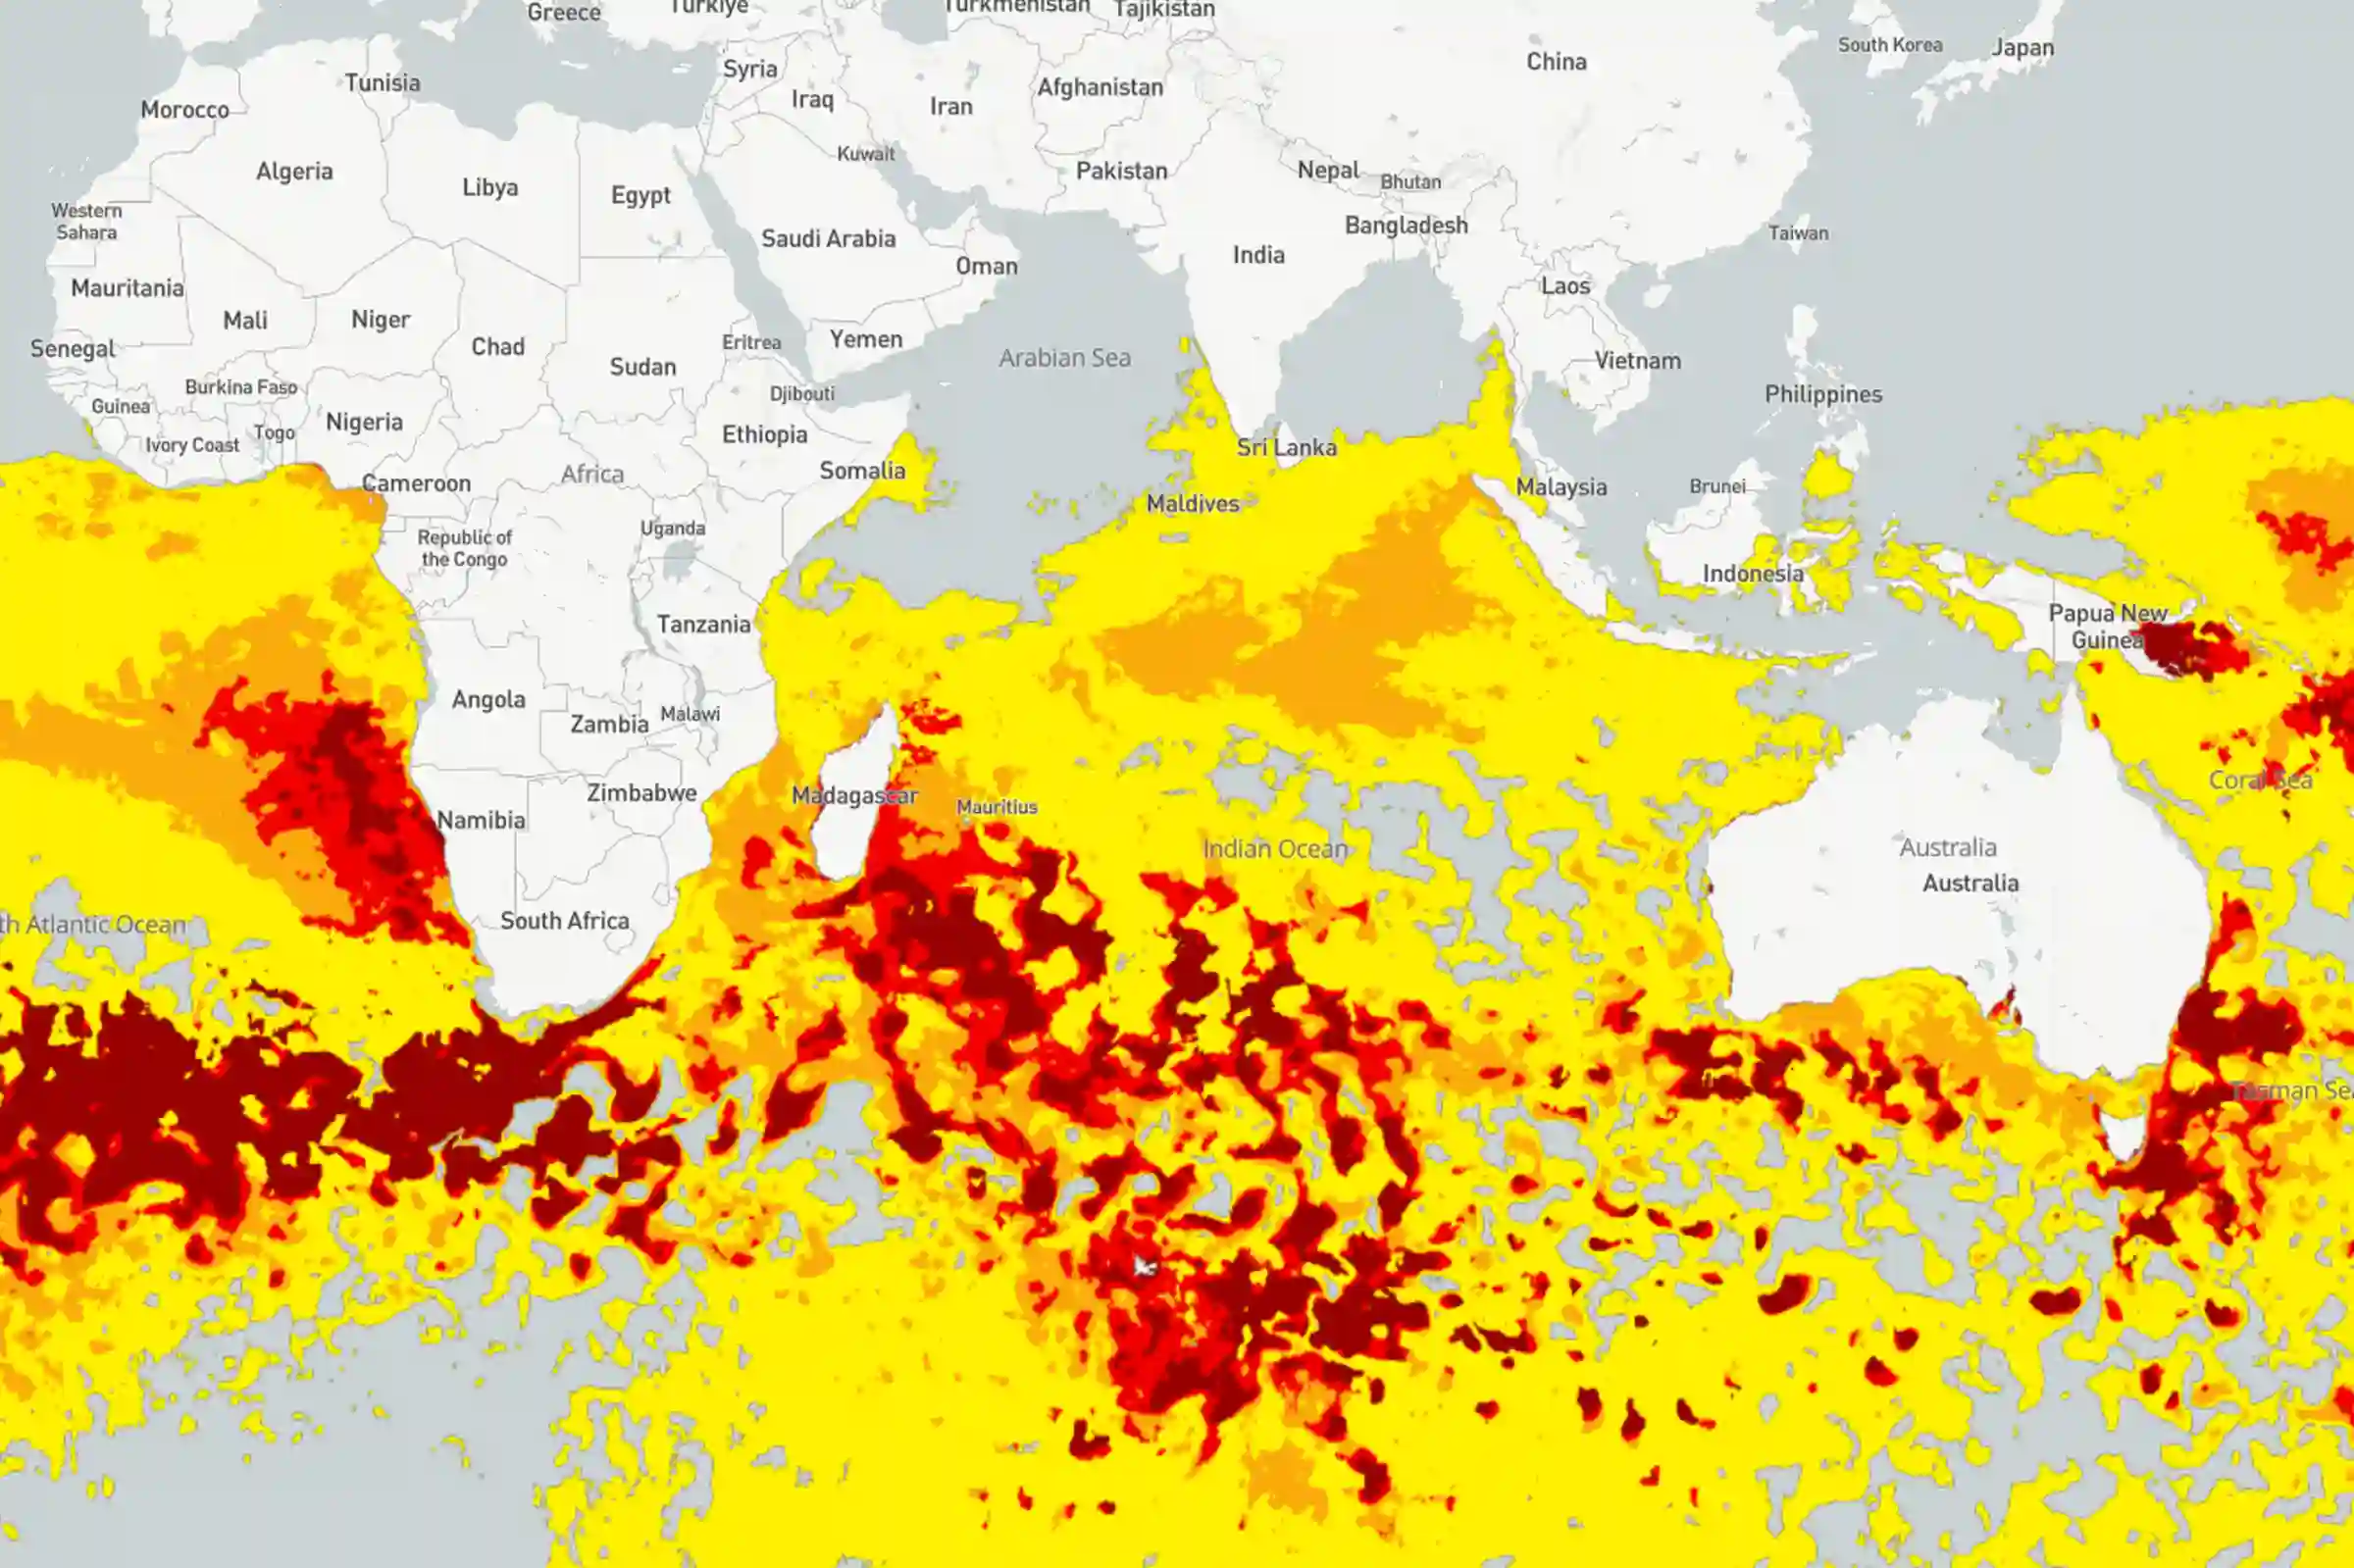
Paul Allen's Vulcan Inc. partners with coral researcher Ruth Gates and Greg to build a global coral reef monitoring system using satellite imagery. Planet provides nanosatellite data. Allen funds approximately $9 million. The coral bleaching detection system is based on GAO technology.
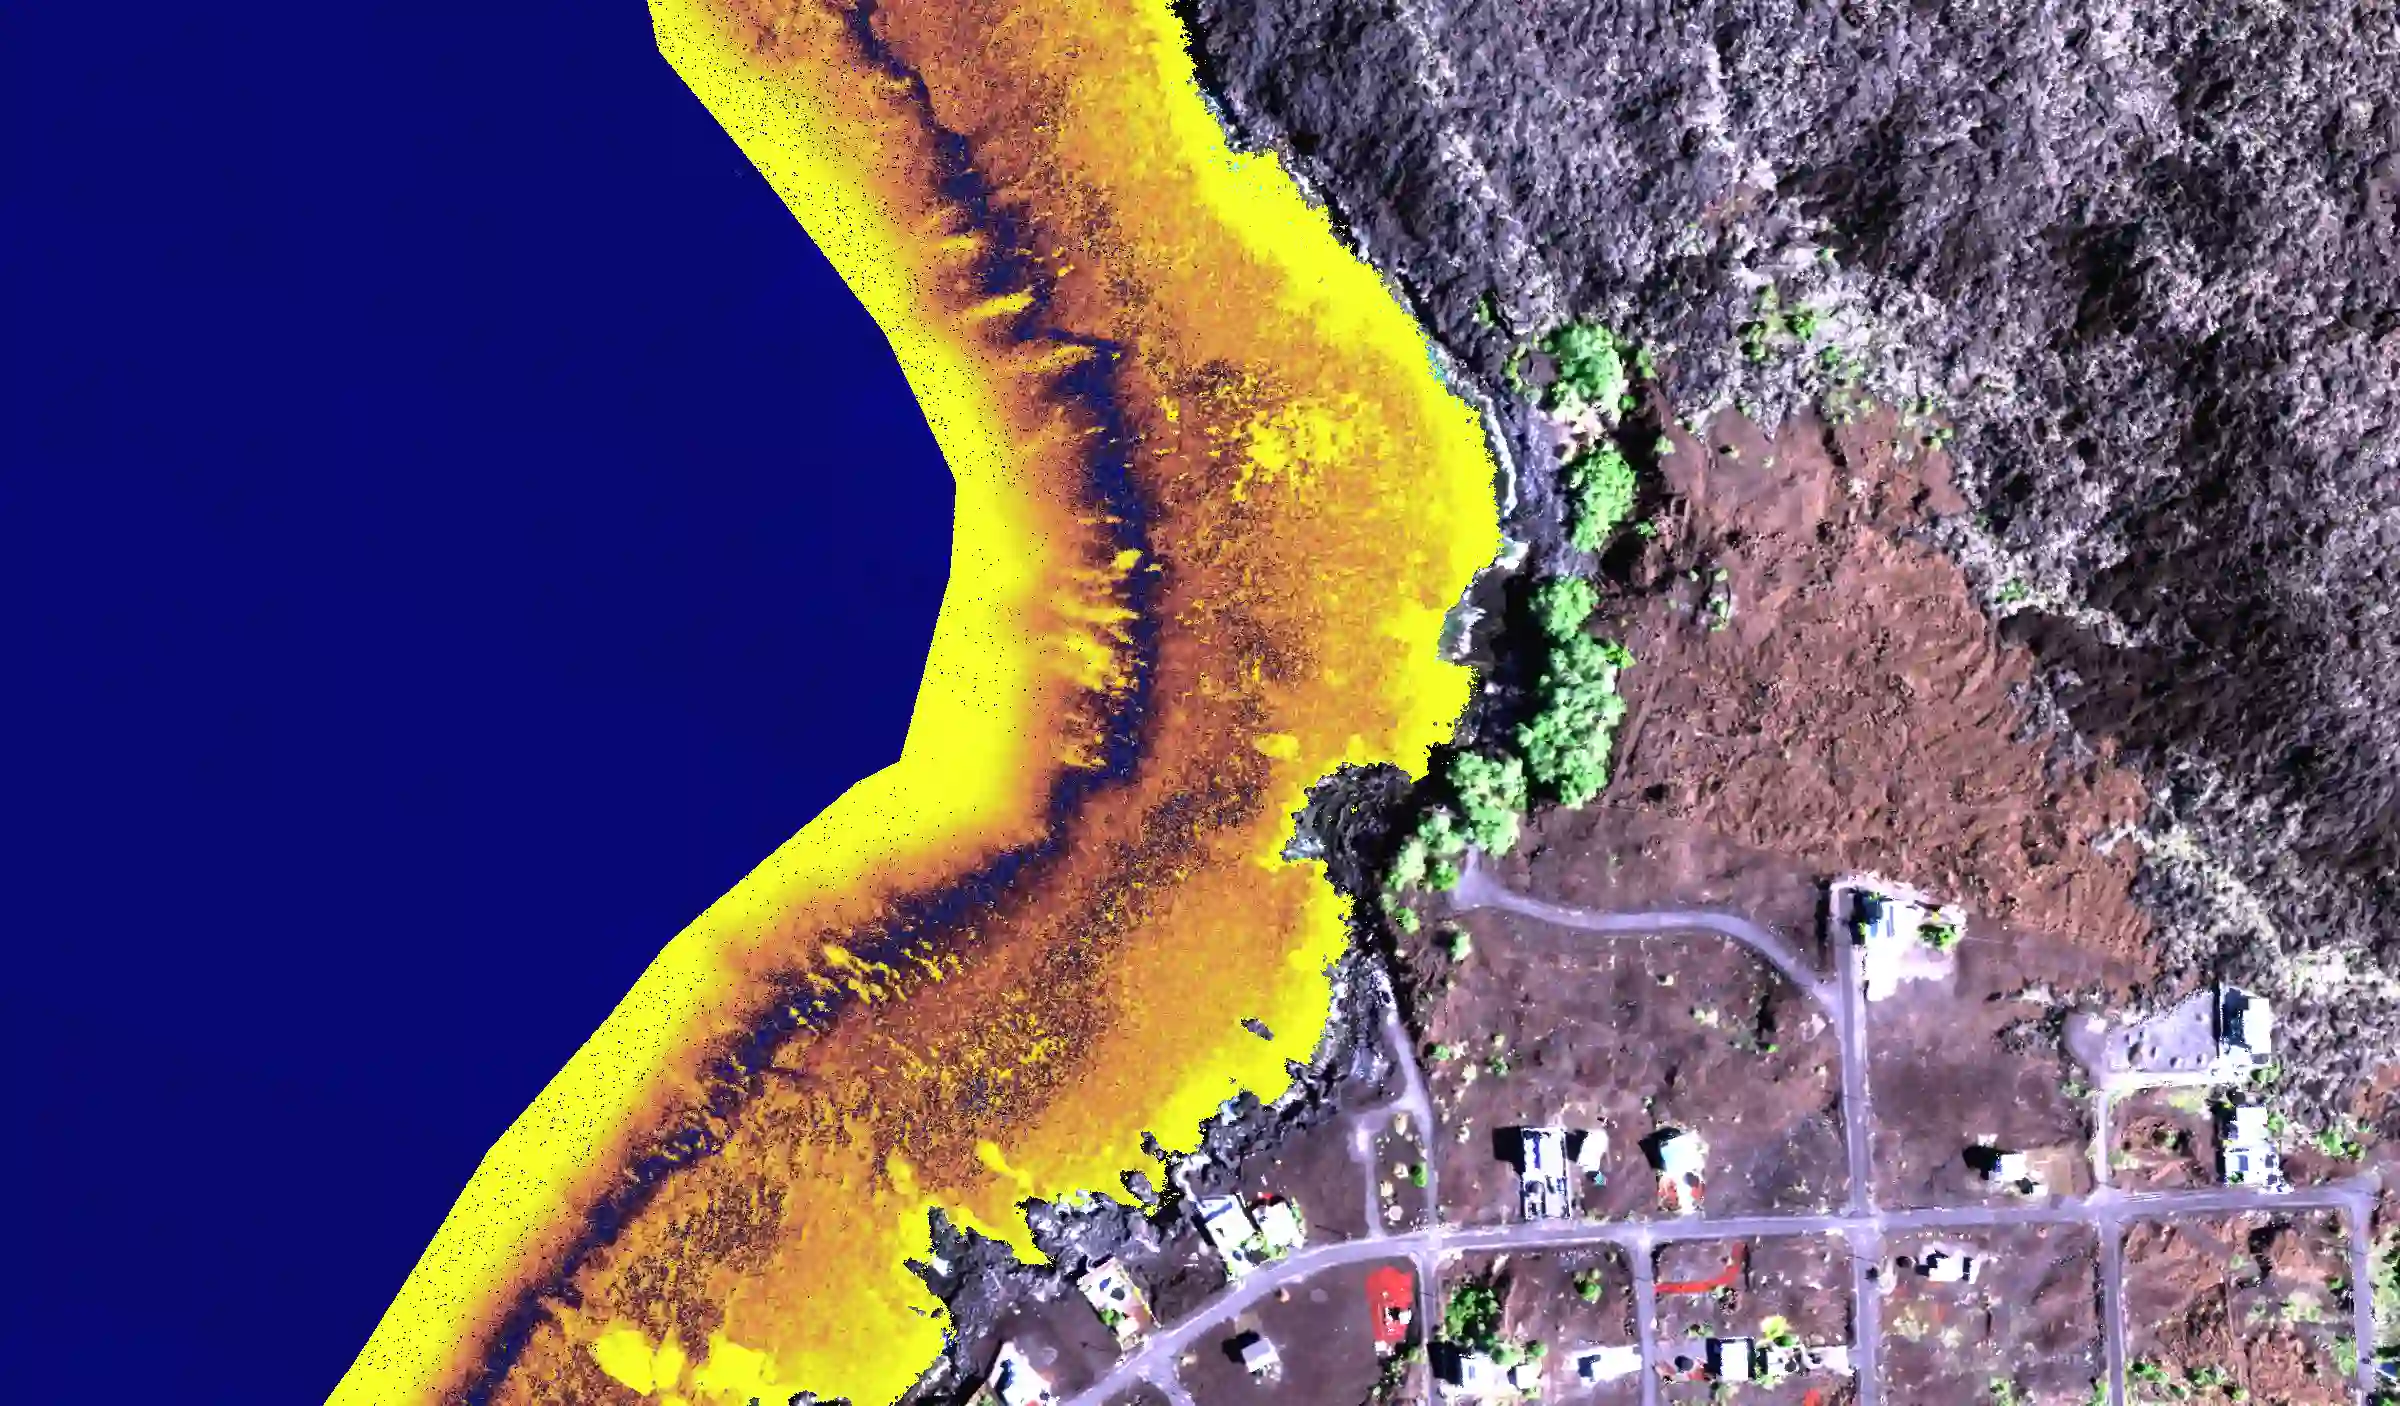
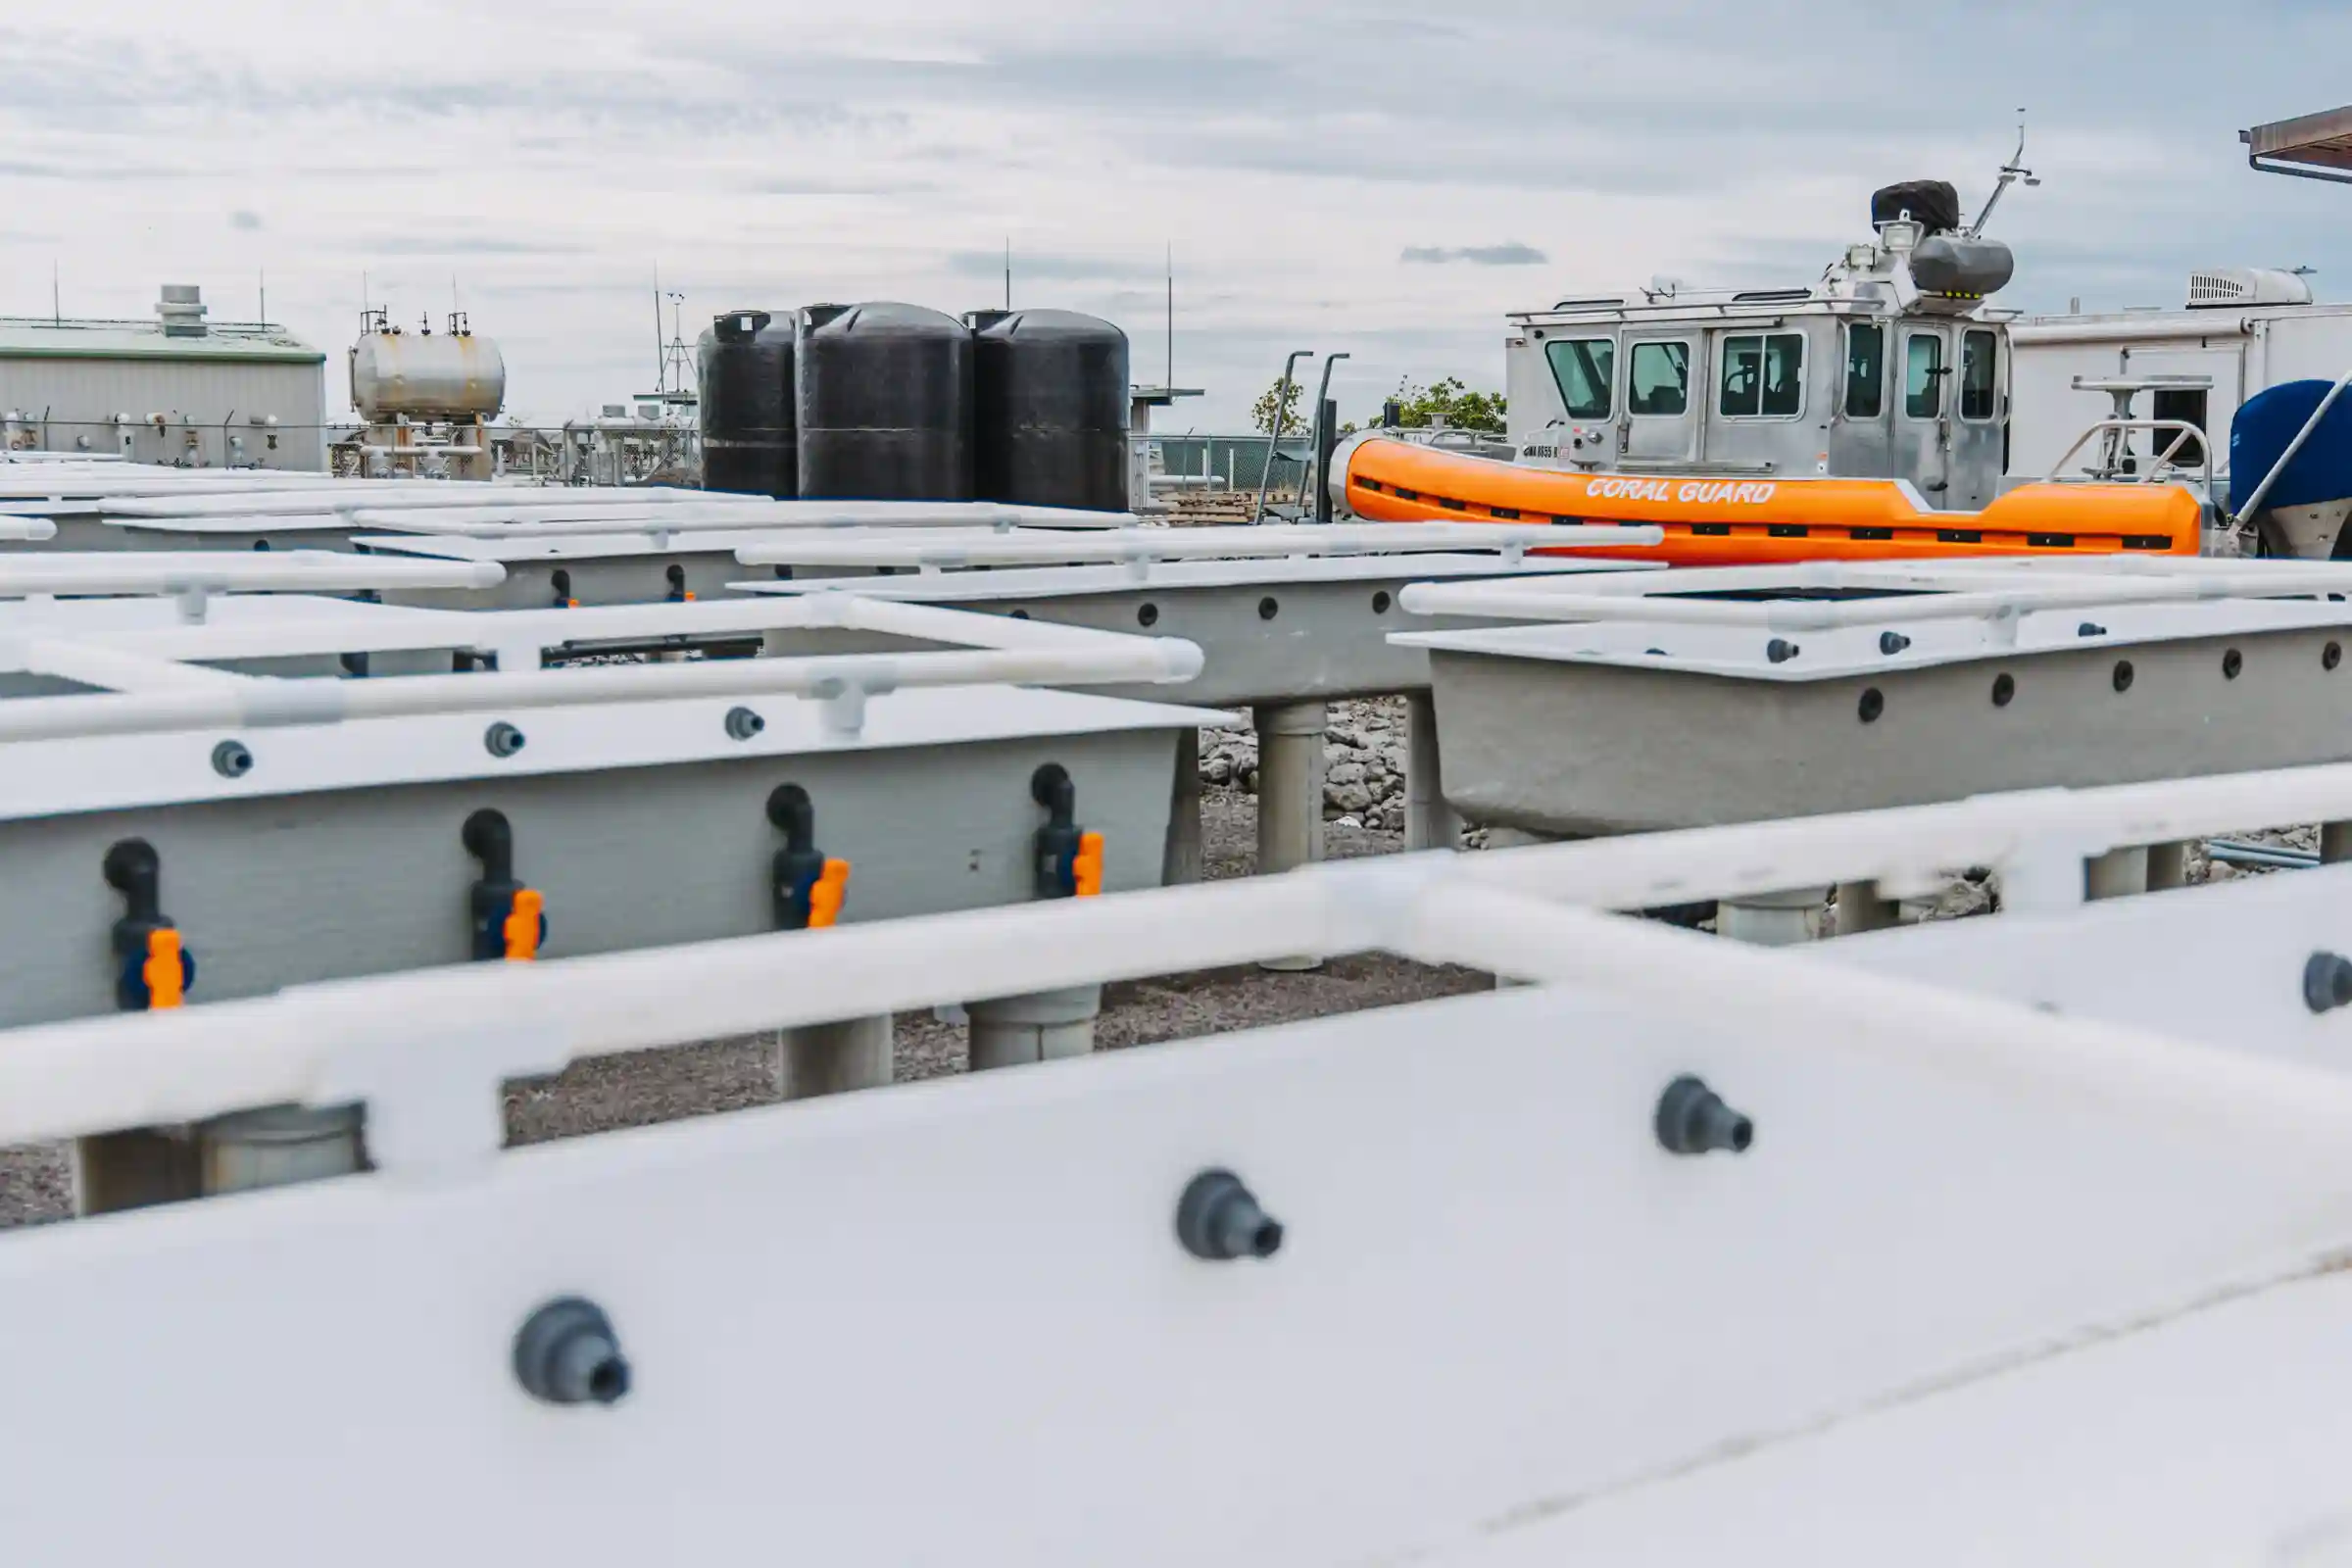
'Āko'ako'a Reef Restoration Founded
Greg founds the 'Āko'ako'a Reef Restoration Program in collaboration with Hawai'i Division of Aquatic Resources and West Hawai'i communities. Fuses cultural leadership, education, science, and government engagement.

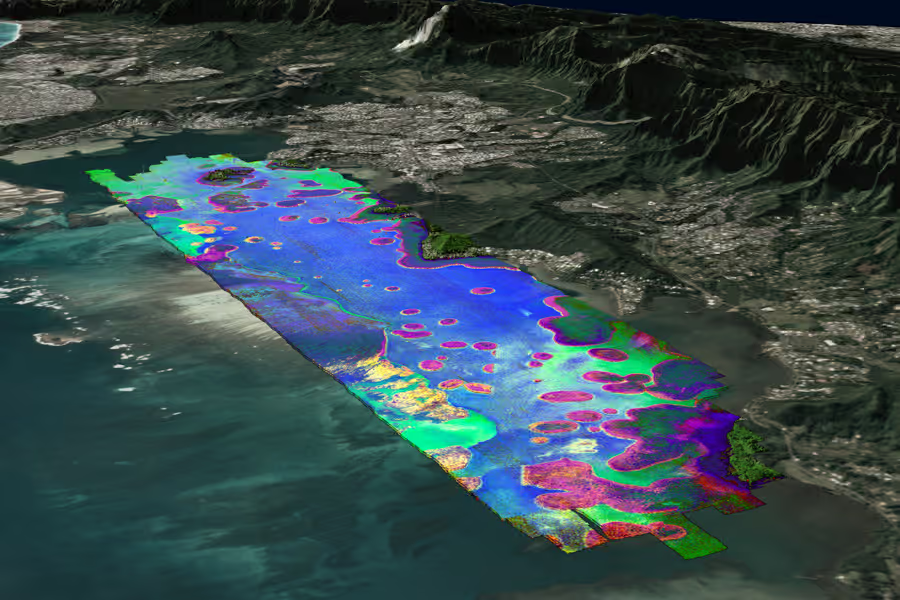
Got Weeds?
California land managers and scientists bring GAO back for more invasive weed mapping. Read the research: Mapping distribution patterns of invasive alien species in the Santa Monica Mountains using airborne imaging spectroscopy and line-point transect data.